Suppose you cycle for two hours at a steady 200 W. During the first 30 minutes your heart rate is 138 bpm, rising to 155 near the end despite unchanged watts. Which zone did you train in?
Both readings may be correct. External intensity—the watts you produced—did not change, but the internal load needed to sustain it did. Duration, temperature, dehydration and accumulating fatigue can gradually raise heart rate without increasing speed or power. This is called cardiac drift.
This is the key to understanding Heart Rate Zones: heart rate does not directly measure the work you produce. It measures part of your body’s response to that work.
Heart rate measures response, not external intensity
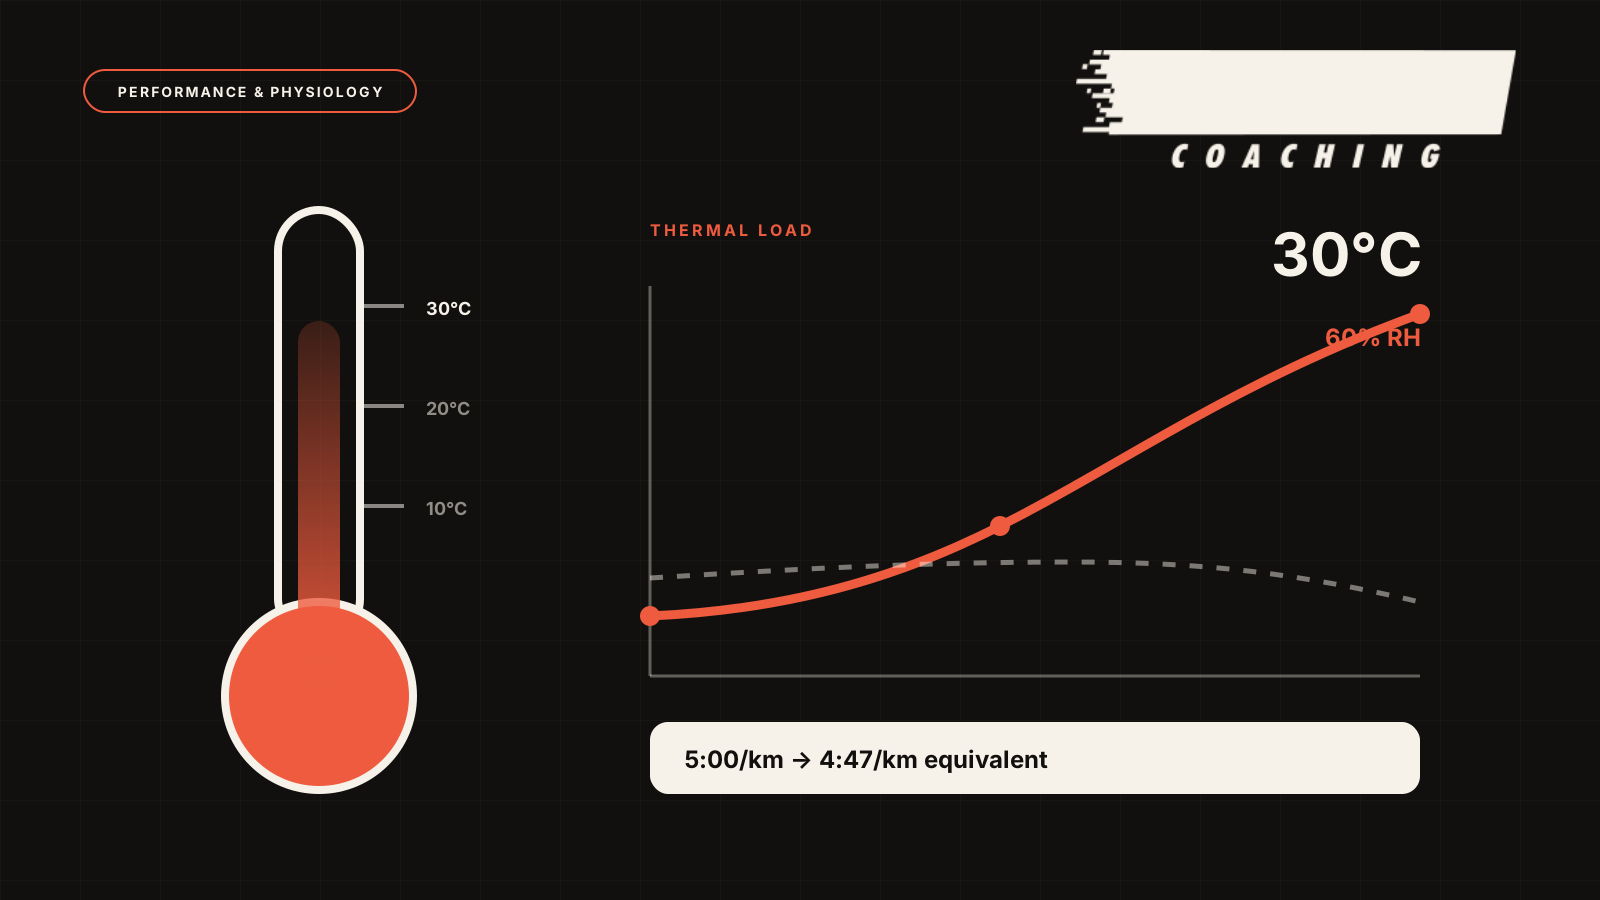
Running pace and cycling watts describe external output. Heart rate indicates the cardiovascular strain needed to support it. It is therefore affected by factors such as:
- temperature and humidity,
- hydration,
- effort duration,
- fatigue and recovery,
- sleep, stress and caffeine,
- a viral illness or another change in health.
Heart rate zones are useful as a framework for monitoring internal intensity. They become misleading when treated as an absolute speed and intensity limit for every minute of training.
LTHR is a practical reference, not HRmax
HRmax is the highest heart rate you can reach in a maximal effort. LTHR—Lactate Threshold Heart Rate—is used in coaching as a reference for zones around an intense effort sustainable for a limited time.
The familiar 220 − age formula gives a general population estimate of maximum heart rate, not a personal measurement. My coaching experience has shown how large the discrepancy can be. Two athletes of the same age may have very different HRmax values; even with identical HRmax, they may differ in LTHR and physiological training response.
Field-test LTHR is also an estimate. It does not measure blood lactate concentration or automatically equal the threshold from a laboratory lactate test. It is a practical, repeatable indicator when the same protocol is used and data are compared within the same sport.
How to estimate LTHR with a 30-minute time trial
The Heart Rate Zones Calculator uses Joe Friel’s method: perform a solo 30-minute time trial and use average heart rate over the final 20 minutes as LTHR.
To make the result useful:
- Choose a flat, uninterrupted route or use a bike trainer with a fan and adequate cooling.
- Warm up thoroughly and use a chest strap for greater accuracy.
- Start the 30 minutes at an intensity you believe you can sustain to the finish. Avoid an excessively fast start.
- At 10 minutes, press the
lap buttonwithout changing intensity. - Average heart rate over the final 20 minutes estimates LTHR for that sport.
The test should be your maximal steady effort for its entire duration—not ten controlled minutes followed by twenty as hard as possible. Do not chase a particular heart rate. Assess the data afterwards.
Poor pacing, accumulated fatigue, heat or unreliable recording can distort the measurement. A result you can reproduce in similar conditions is more valuable.
LTHR differs between running and cycling
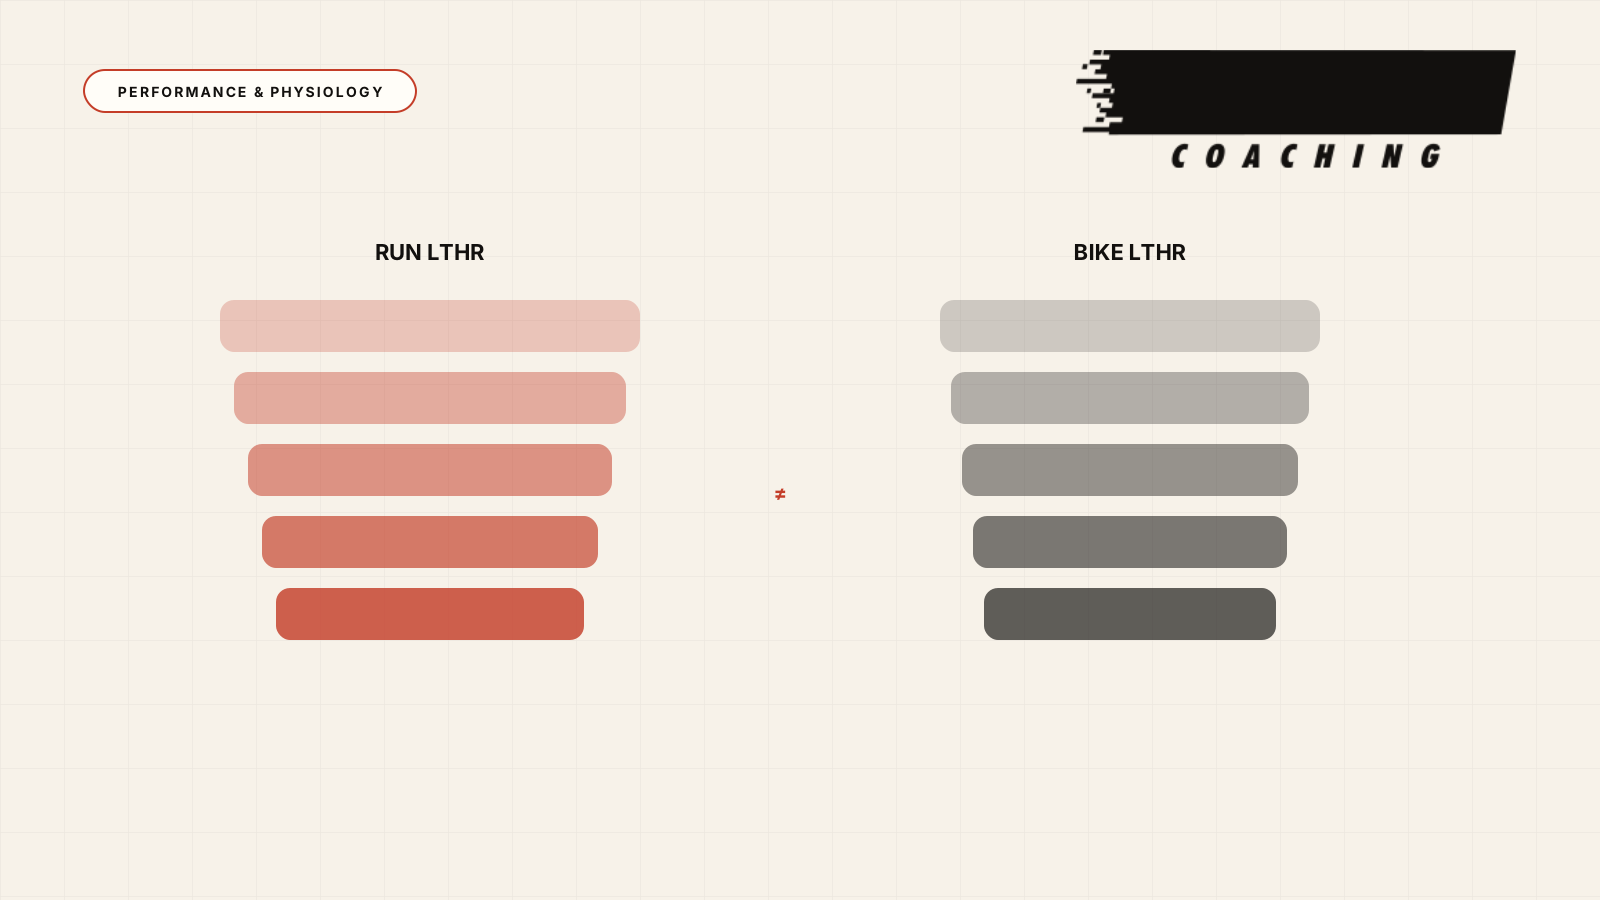
Do not assume running and cycling LTHR are identical. Body position, different muscle recruitment, familiarity with each sport and movement mechanics influence heart-rate response.
Many athletes have higher running than cycling LTHR, but the difference is not universal. Arbitrarily subtracting 5 or 10 bpm from running LTHR does not guarantee correct cycling zones. Research in experienced triathletes found that even when the average difference between sports was small, individual error was large enough to justify separate testing.
If you train in both sports, perform a separate 30-minute time trial for each. The calculator can then apply the appropriate percentages to a measurement from the same sport.
The calculator’s seven zones
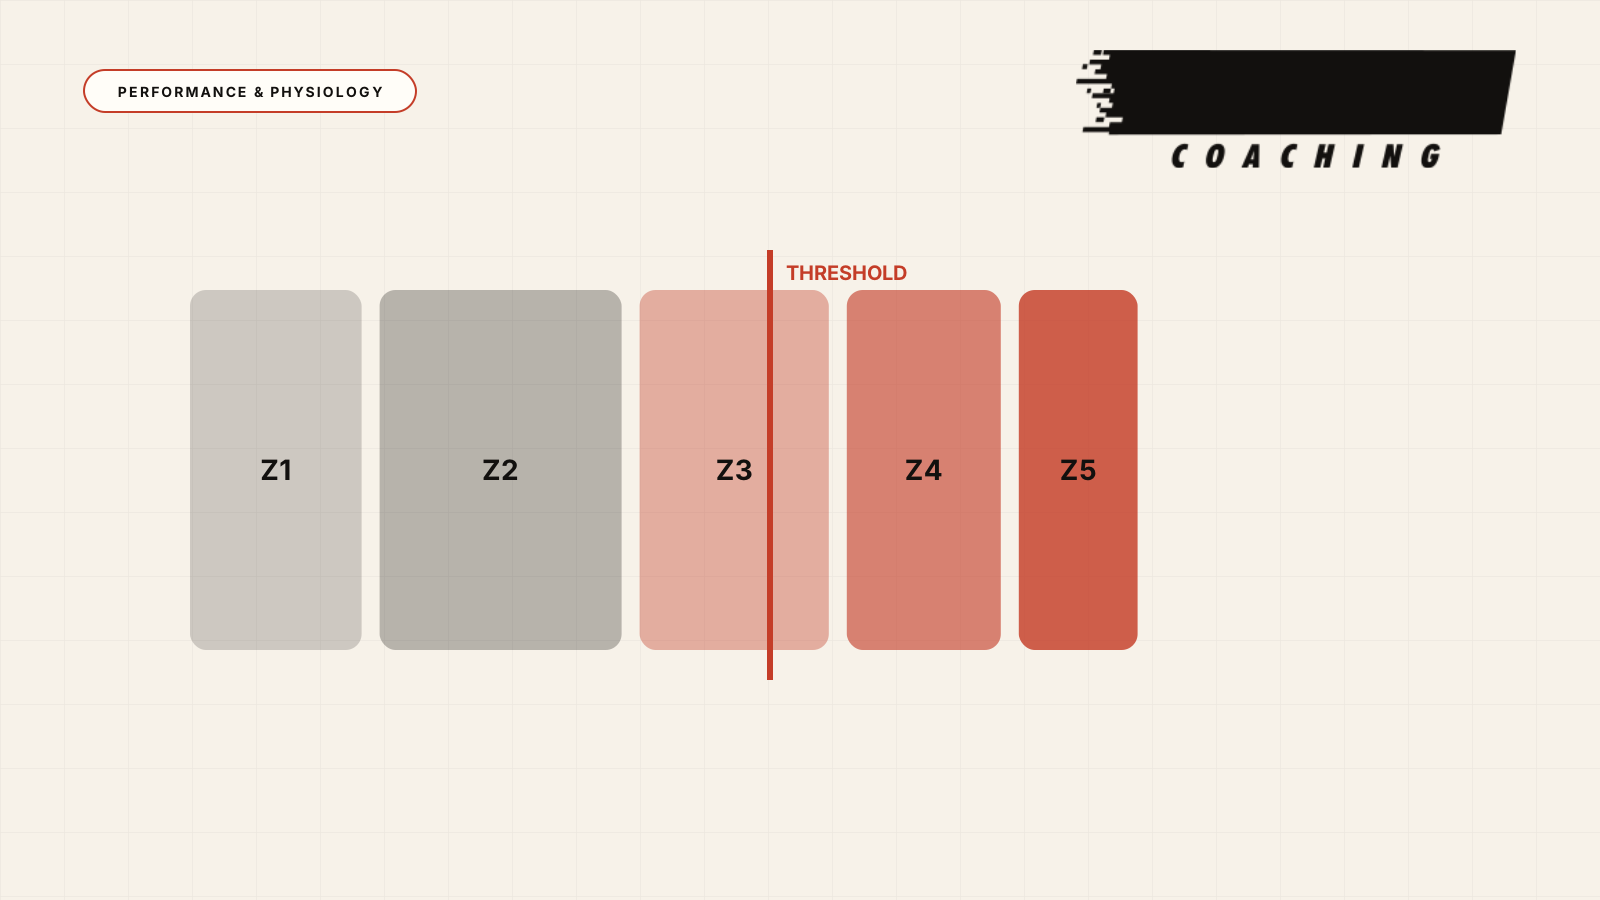
No single zone-setting method is a universal physiological standard. This calculator follows the classic seven-zone version of Joe Friel’s system, published by TrainingPeaks with different running and cycling percentages:
| Zone | Run — % LTHR | Bike — % LTHR | Intensity explained |
|---|---|---|---|
| Z1 Recovery | Below 85% | Below 81% | Very easy effort |
| Z2 Endurance | 85–89% | 81–89% | Aerobic endurance and easy training |
| Z3 Tempo | 90–94% | 90–93% | Moderate-to-high intensity |
| Z4 Threshold | 95–99% | 94–99% | Sustained effort near threshold |
| Z5a Super-threshold | 100–102% | 100–102% | Effort slightly above LTHR |
| Z5b Aerobic Capacity | 103–106% | 103–106% | High aerobic intensity |
| Z5c Anaerobic Capacity | Above 106% | Above 106% | Very high intensity for short efforts |
These names describe intensity ranges, not seven entirely separate physiological states. Friel himself has revised his approach, so the table represents this calculator’s model rather than the only accepted method.
Especially in Z5b and Z5c, heart rate may not rise quickly enough to follow a short, intense repetition. Not reaching that heart-rate zone does not necessarily mean the effort was less intense.
Heart-rate lag and cardiac drift change the picture
Heart rate responds with a delay to sudden intensity changes. During a three-minute repetition, it may take a substantial part of the interval to reach the level corresponding to the effort. Accelerating to see the desired number immediately may make the repetition harder than intended.
The opposite pattern appears during prolonged efforts. At constant pace or power, heart rate can gradually rise over time. This cardiac drift is usually more pronounced with heat, dehydration and longer duration.
Drift alone does not mean the session was poorly executed. During an easy long run or long ride, it can show rising internal load despite stable external output. If it is much greater than usual, assess conditions, hydration, intensity and recovery before drawing conclusions about fitness.
Combine HR, pace or power, and RPE
No single measurement tells the whole training story:
| Measurement | What it shows best |
|---|---|
| Pace or power | Your external output |
| Heart rate | Cardiovascular response to effort |
| RPE and breathing | Your overall perception of intensity |
During easy, prolonged sessions, heart rate helps check whether effort stays easy and how it develops over time. For short intervals, pace or power is usually a better execution guide, with heart rate providing supplementary information. On hills, in heat or with substantial fatigue, RPE and breathing give essential context for interpreting the other numbers.
Prefer a chest strap for LTHR testing: wrist optical sensors show greater variability, particularly with changes in movement or skin contact. Check the graph for unrealistic spikes or dips before using the average to set zones.
The calculator calculates zones; it does not assess the test
In the Heart Rate Zones Calculator:
- select
RunorBike, - enter LTHR from a test in that sport,
- use the seven zones as a training starting point.
The calculator applies percentages and rounds boundaries to beats per minute without gaps or overlaps. It cannot know whether the test was well executed, the device recorded accurately or the method ideally describes your physiology.
Do not change LTHR because one session feels unusually easy or difficult, and do not accept watch estimates without checking them. Retest following a meaningful fitness change or when several sessions consistently suggest your zones no longer reflect reality.
If you repeatedly notice unexplained high or irregular heart rate, particularly with chest pain or dizziness, stop training and seek medical assessment.
Key takeaways
- Heart rate indicates internal response, not directly the speed or power you produce.
- LTHR is neither HRmax nor a laboratory lactate measurement. In the 30-minute protocol, it is estimated from the final 20-minute average.
- Running and cycling require separate tests and different zones.
- The calculator uses seven zones, from Z1 to Z5c, with sport-specific percentages.
- Heart-rate lag limits usefulness during short intervals, while cardiac drift affects prolonged efforts.
- Combine heart rate with pace or power and RPE for a fuller picture.
Use the Heart Rate Zones Calculator to convert running or cycling LTHR into the corresponding heart rate zones, then assess them across repeated sessions rather than from one isolated reading.
Sources and further reading
- Friel J. Joe Friel’s Quick Guide to Setting Zones — original seven-zone LTHR model. TrainingPeaks.
- Friel J. A Quick Guide to Setting Zones — revised approach. Joe Friel Training. 2025 revision.
- Carey DG et al. Transferability of running and cycling training zones in triathletes: implications for steady-state exercise. Journal of Strength and Conditioning Research. 2009.
- Tanaka H, Monahan KD, Seals DR. Age-predicted maximal heart rate revisited. Journal of the American College of Cardiology. 2001.
- Achten J, Jeukendrup AE. Heart rate monitoring: applications and limitations. Sports Medicine. 2003.
- Coyle EF, González-Alonso J. Cardiovascular drift during prolonged exercise: new perspectives. Exercise and Sport Sciences Reviews. 2001.
- Gillinov S et al. Variable Accuracy of Wearable Heart Rate Monitors during Aerobic Exercise. Medicine & Science in Sports & Exercise. 2017.
- Faude O, Kindermann W, Meyer T. Lactate threshold concepts: how valid are they? Sports Medicine. 2009.