Heart Rate Zones Calculator
Calculate Heart Rate Zones from your Lactate Threshold Heart Rate (LTHR) using Joe Friel’s system, with different boundaries for Run and Bike.
170 bpm · Run · 7 zones
| Zone | % LTHR | bpm |
|---|---|---|
| Z1 — Recovery | <85% | ≤145 |
| Z2 — Endurance | 85–89% | 146–151 |
| Z3 — Tempo | 90–94% | 152–160 |
| Z4 — Threshold | 95–99% | 161–168 |
| Z5a — Super-threshold | 100–102% | 169–173 |
| Z5b — Aerobic Capacity | 103–106% | 174–180 |
| Z5c — Anaerobic Capacity | >106% | 181+ |
LTHR 170 bpm
How to use it
Select Run or Bike and enter your LTHR. If you do not know it, complete a properly paced solo 30-minute time trial and use average heart rate from the final 20 minutes. Use a separate LTHR for running and cycling. The seven zones update automatically.
What you need to know
LTHR is an estimate and is not maximum heart rate. Do not use 220 − age or apply the same LTHR to Run and Bike. Heart rate is affected by heat, dehydration, fatigue, stress and cardiac drift. It also responds slowly to brief intensity changes. Use zones alongside RPE and, where available, pace or power.
Read the related article
Heart rate shows your body’s response, not the whole effort.
Heart rate is valuable for monitoring intensity, but needs interpretation in the context of duration, conditions and fatigue. Together, we can combine heart rate, pace or power and RPE so every session has a clear purpose.
Methodology & Sources
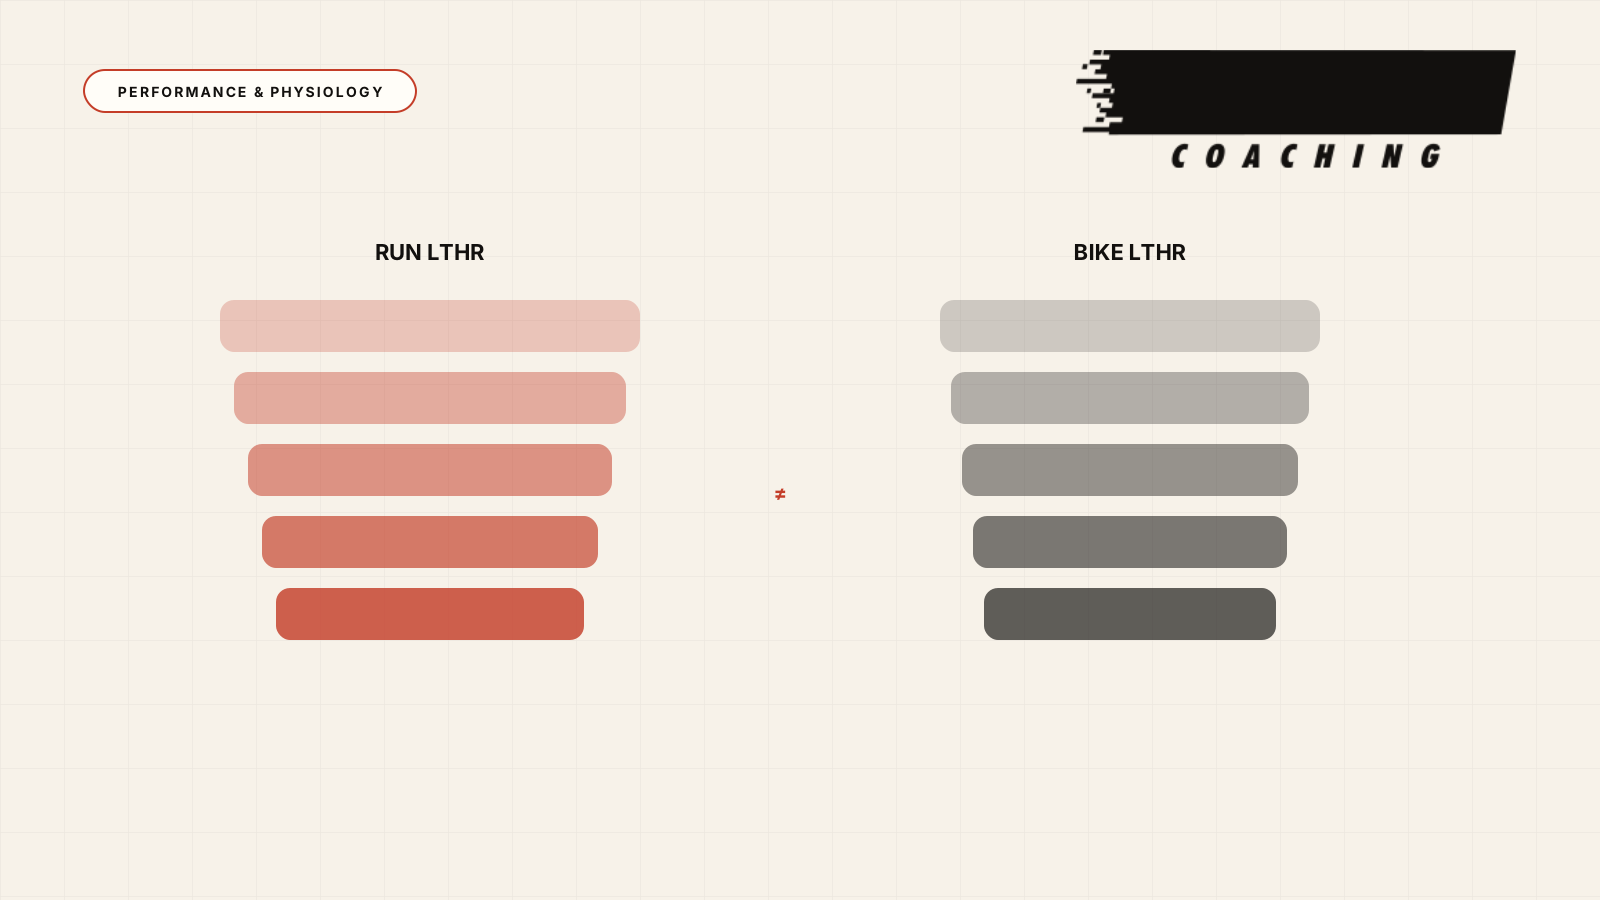
Zones follow Joe Friel’s model and are calculated as LTHR percentages. Run: Z1 Recovery <85%, Z2 Endurance 85–89%, Z3 Tempo 90–94%, Z4 Threshold 95–99%, Z5a Super-threshold 100–102%, Z5b Aerobic Capacity 103–106% and Z5c Anaerobic Capacity >106%. Bike: Z1 Recovery <81%, Z2 Endurance 81–89%, Z3 Tempo 90–93%, Z4 Threshold 94–99%, Z5a Super-threshold 100–102%, Z5b Aerobic Capacity 103–106% and Z5c Anaerobic Capacity >106%. No intermediate rounding is applied. Final boundaries display to the nearest beat, without gaps or overlaps between zones.
Last updated: 2 July 2026