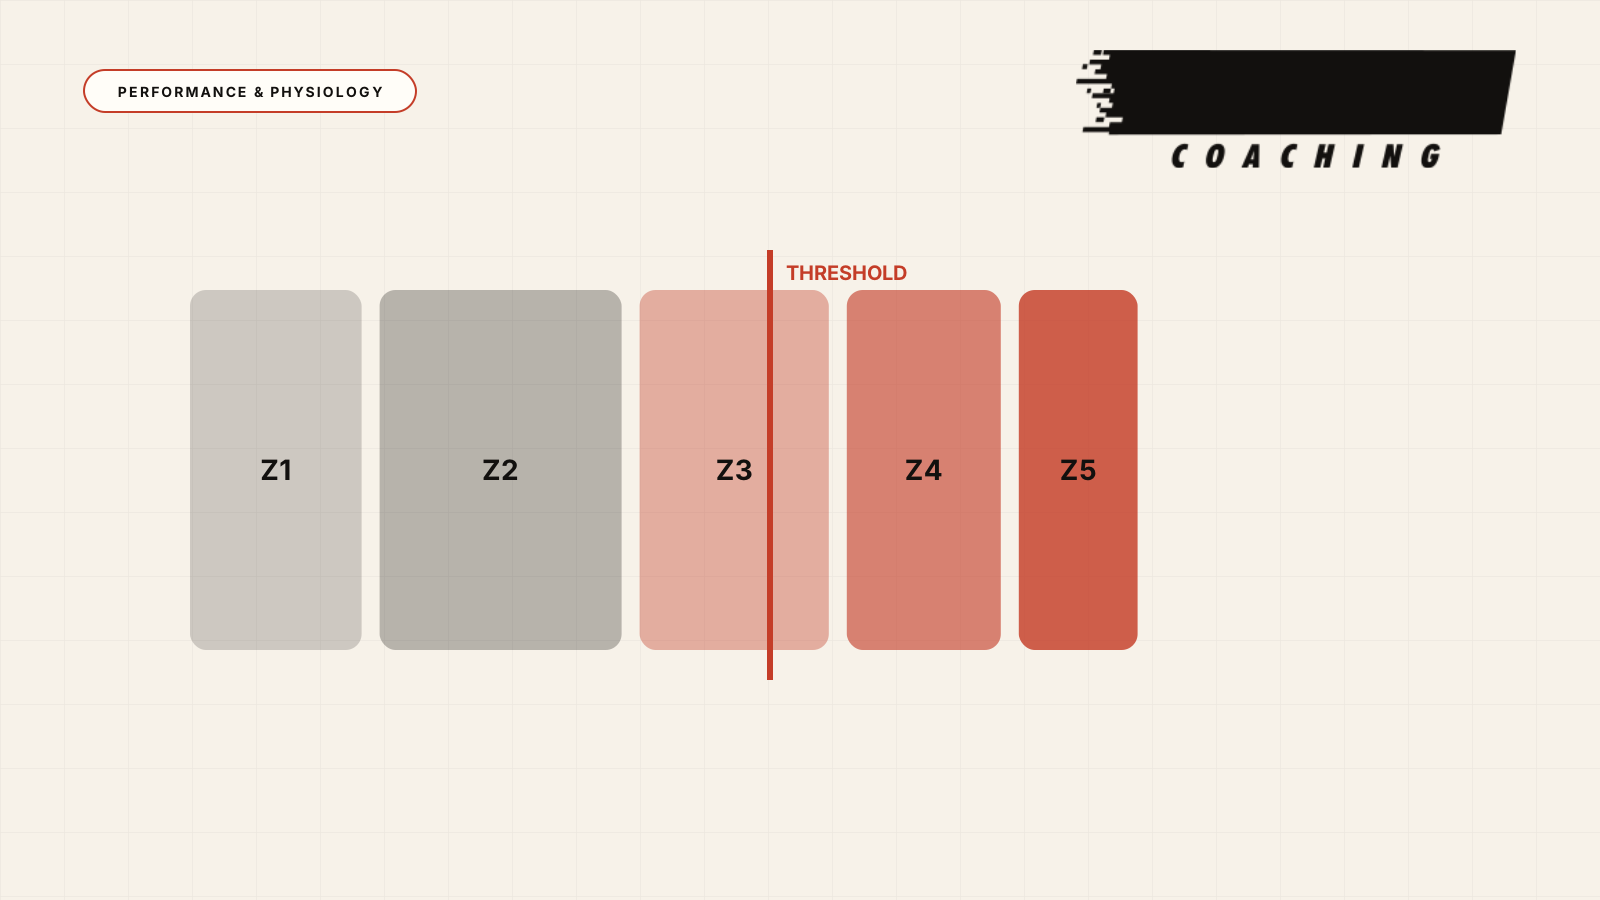
With threshold pace at 4:00/km, the Running Pace Zones calculator puts 4:15/km at the fast end of Zone 3 and 4:14/km at the slow end of Zone 4.
Does that one-second difference mean your body switched energy systems?
No.
That second is where the calculator divides two training zones, not a magic biological switch. Pace zones organise training by translating a central ability marker into practical ranges for recovery, endurance, tempo, threshold and higher intensities.
Boundaries help plan and prescribe sessions. They are not points where physiology changes abruptly at the flick of a switch.
What pace zones are—and are not
Without zones, every session would need to be described only through duration, RPE, breathing, heart rate and purpose. Zones provide a common practical language: “40 minutes in Zone 2” or “3×10 minutes near threshold” offers a specific reference.
A pace zone is not the session itself. It is the range from which pace is selected according to:
- session purpose,
- effort duration,
- recovery duration and type,
- overall fatigue,
- course and weather.
A 45-minute aerobic run and a two-hour long run can occupy the same broad zone but impose different costs and need not use exactly the same pace.
“Zone 2” does not mean the same pace in every session
Models may have three, five, six or seven zones and use heart rate, pace, watts, lactate, ventilatory thresholds or critical speed. “I ran in Zone 2” cannot tell us the purpose or outcome without knowing the model.
Many scientific studies divide intensity into three broad zones using two physiological thresholds. Most coaching systems use more, narrower zones to simplify planning different sessions.
The Running Pace Zones Calculator uses Joe Friel’s 7-zone running model. Functional Threshold Pace defines Z1, Z2, Z3, Z4, Z5a, Z5b and Z5c. Its names and boundaries should not be transferred unchanged to another system.
Everything starts with threshold pace
The calculator can perform perfect arithmetic yet give unsuitable zones if the entered threshold pace does not represent your current condition and actual threshold.
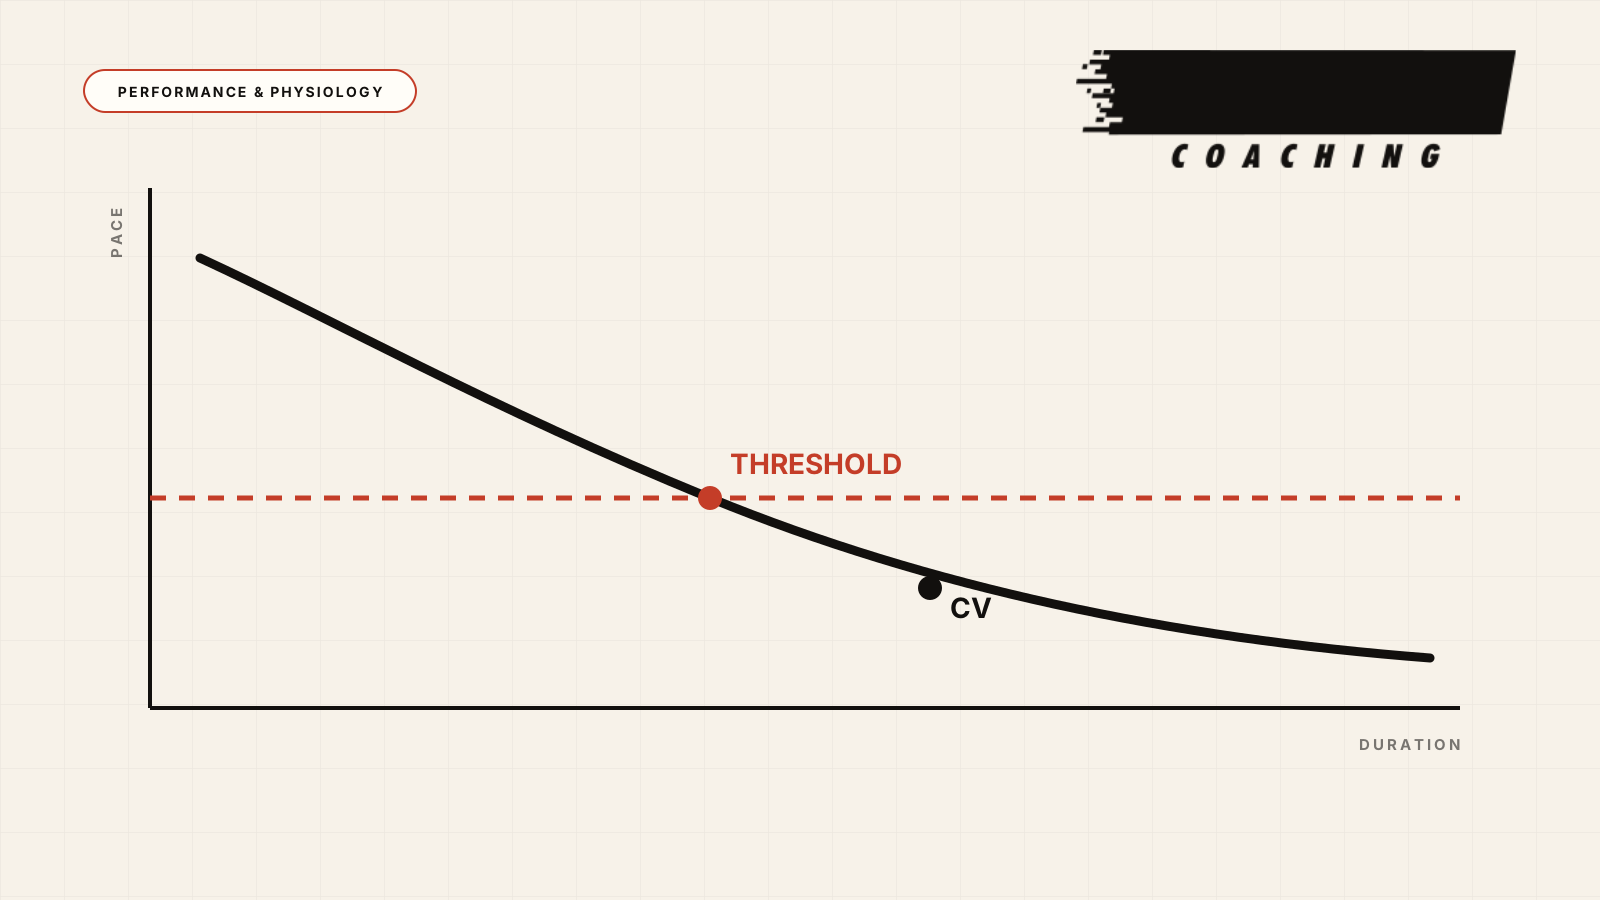
Here, Functional Threshold Pace is a practical reference near a pace sustainable during a prolonged maximal effort. TrainingPeaks suggests estimating it from average pace in a recent race or very hard session lasting around 45–60 minutes.
A well-executed 30-minute time trial can also provide a useful estimate. Evidence supports its use for estimating running speed near threshold, but it remains a field-test or race estimate, not a direct physiological measurement.
For a reasonably accurate threshold pace, prioritise:
- A recent, truly maximal race lasting around 45–60 minutes.
- A well-executed field test with a defined protocol.
- An estimate from multiple recent performances or an appropriate threshold/critical-speed model.
- A smartwatch estimate confirmed by training, not accepted blindly.
Watch estimates are useful but fallible. Studies in recreational runners found substantial discrepancies between device threshold paces and laboratory or maximal-effort results. Use the watch as a starting point, then check it against actual training response.
If threshold is overestimated:
- easy runs may become moderate-intensity sessions,
- tempo sessions may become threshold work,
- threshold intervals may become excessively hard or impossible early on.
If underestimated:
- some key sessions may be substantially easier than intended,
- zone paces may be defined and used misleadingly,
- the gap between actual RPE and zone names may grow.
Do not arbitrarily change every zone. First check the threshold estimate’s source, recency and confirmation across multiple sessions.
Why percentages apply to speed
Pace is time per distance, the inverse of speed. Faster running means less time per kilometre.
A 4:00/km threshold pace equals 15 km/h. To calculate 80% of threshold speed:
15 × 0,80 = 12 km/h = 5:00/km
Applying 80% directly to 240 seconds per kilometre would give 192 seconds, or 3:12/km—a faster pace, exactly the opposite direction.
A correct calculator therefore:
- converts pace to speed,
- applies the percentage to speed,
- converts back to pace.
This matters when calculating zones manually.
5 or 7 zones: more detail, not more certainty
A 5-zone model is simpler and often sufficient to distinguish recovery, endurance, tempo, threshold and high-intensity paces.
A 7-zone model divides intensity more finely around and above threshold. This can help with varied sessions such as cruise intervals, 3K–5K pace intervals, longer VO₂max repetitions or short high-intensity, high-speed repetitions.
More zones do not automatically make training more specific or scientific. If threshold is wrong or weather incomparable, narrower ranges simply create a stronger illusion of precision.
Choose the model matching how your sessions are prescribed and executed. When comparing apps or coaches, first check that they use the same zone system.
Pace shows what you did, not what it cost
Pace measures external load by describing movement speed. It does not describe the body’s internal response or cost of that intensity.
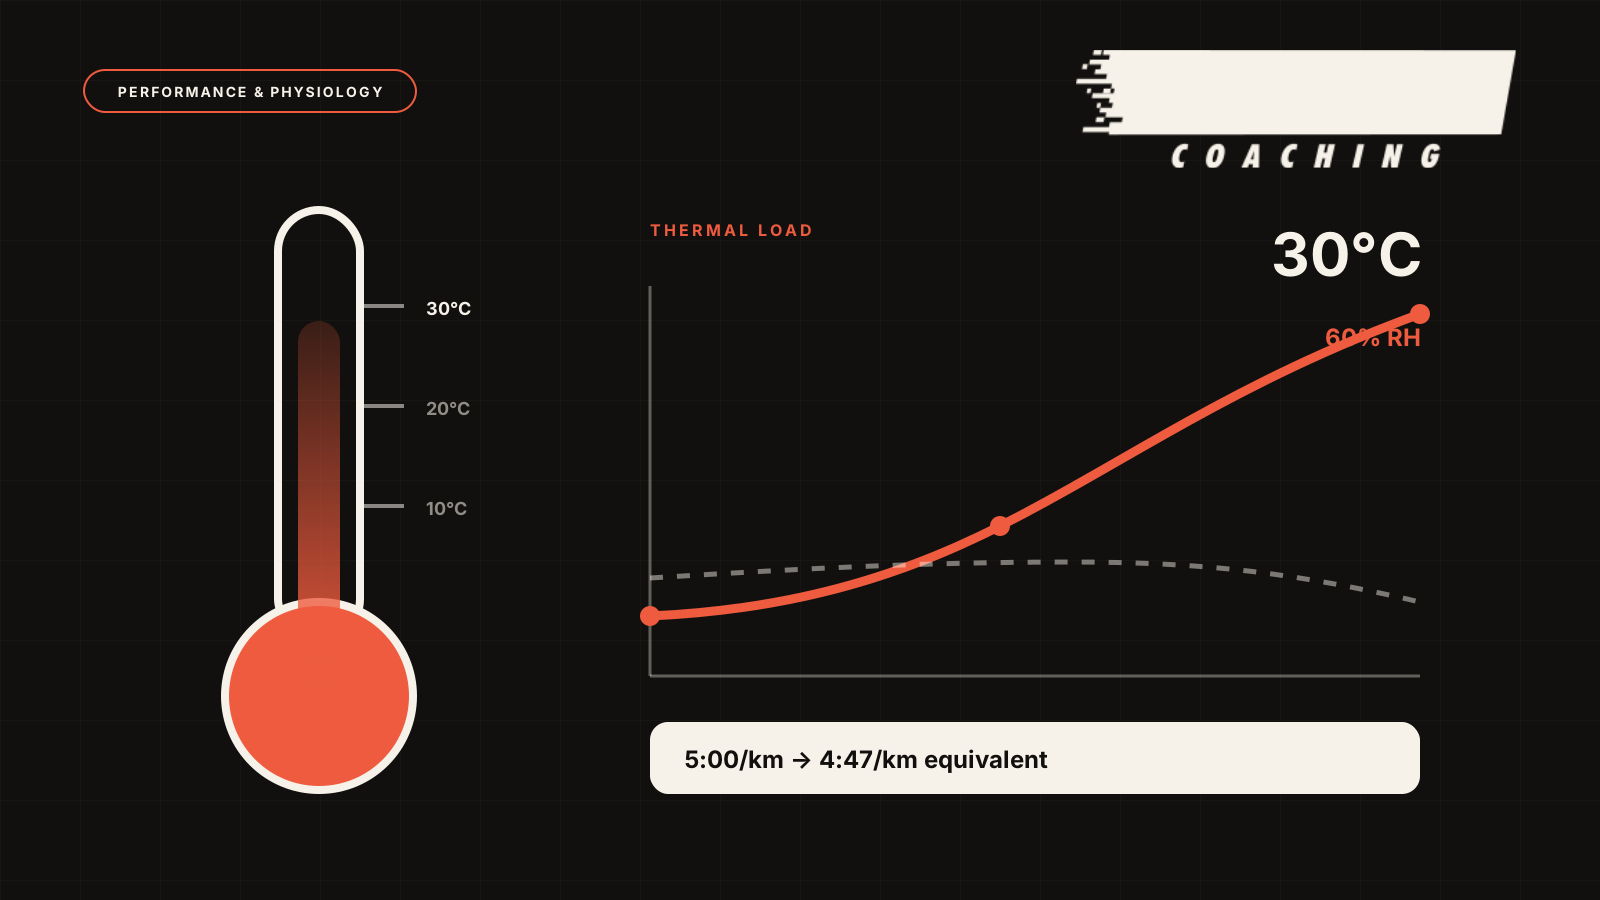
The same 5:00/km can be easy on a flat course in cool weather but noticeably harder:
- in heat or high humidity,
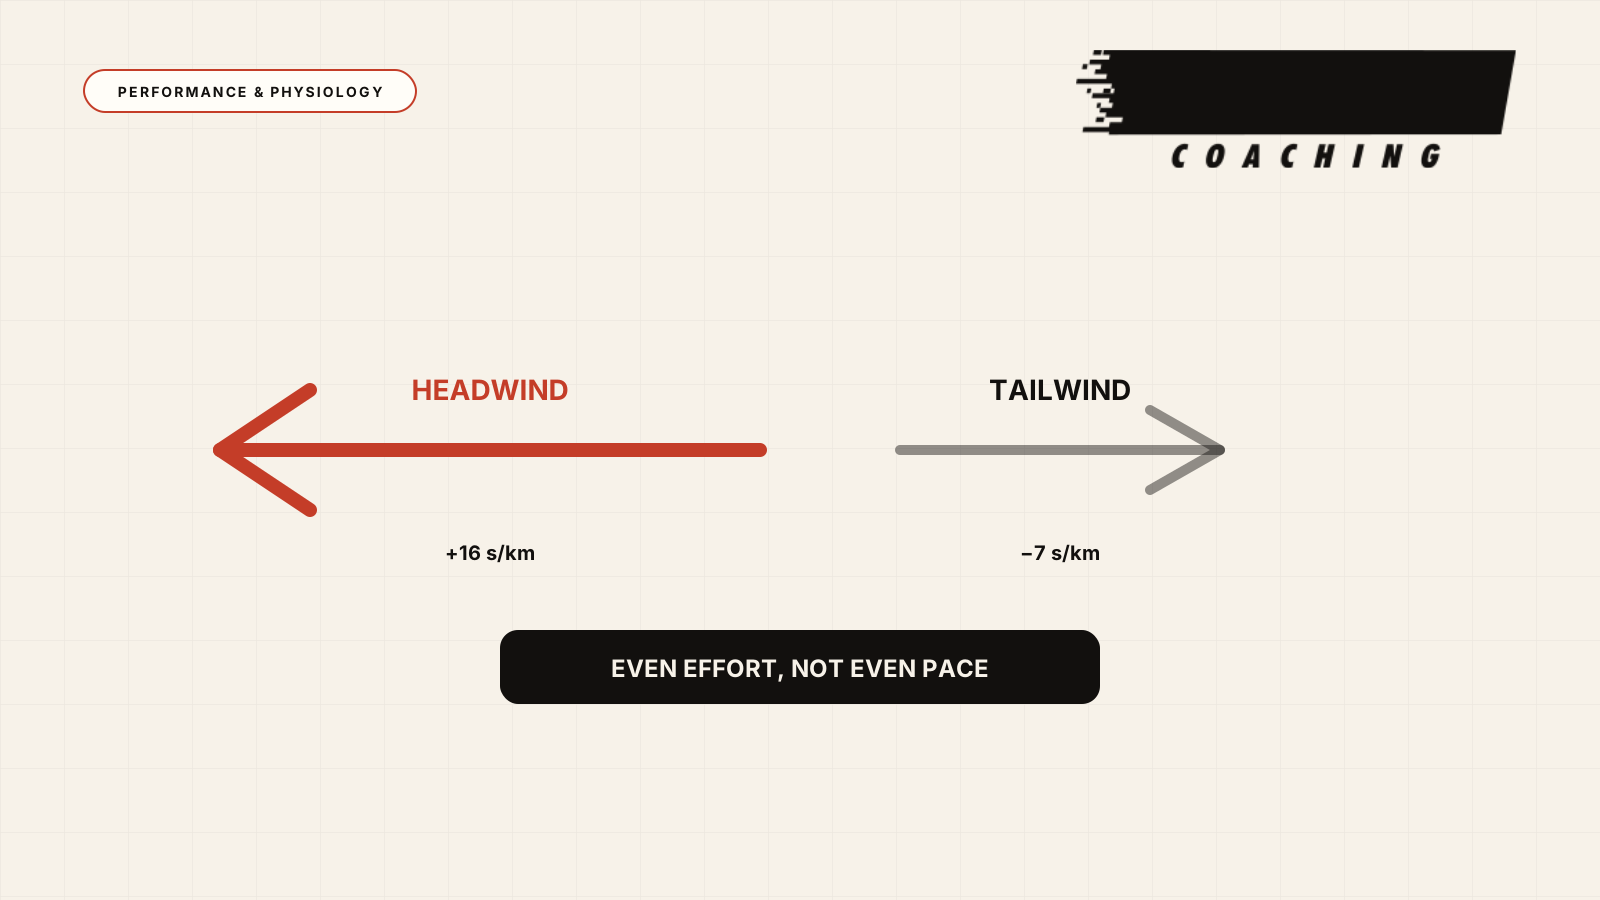
- uphill or into a headwind,
- on dirt or technical terrain,
- after poor sleep or high accumulated training load,
- when recovery or fuelling is inadequate.
Always interpret pace zones alongside:
- perceived exertion (RPE),
- breathing and ability to talk,
- heart rate,
- running technique and late-effort pace stability.
If the watch says Zone 2 but breathing is heavy and heart rate keeps rising, do not lock onto the pace zone. Adjust pace to preserve the intended comfortable basic-endurance session.
Repetition duration and recovery define the session
Ask not only “which zone?” but also “for how long, and with what recovery?”
Three minutes at the fast end of Zone 4 differs from twenty continuous minutes at the same pace. Likewise, 3×10 minutes near threshold with 60 sec easy jog produces a very different response and purpose from 3×10 minutes with five minutes of full recovery.
Interval duration, recovery duration and their relationship change cardiorespiratory and metabolic responses. The zone provides only a numerical pace range; session structure defines the intended outcome.
Easy pace: do not always target the fastest boundary
At 4:00/km threshold pace, the calculator gives Zone 2 Endurance as 4:33–5:07/km and Zone 1 Recovery as 5:08/km or slower.
It is tempting to treat 4:33/km as the pace you “must” run to maximise an easy session. It is actually Z2’s fastest edge, not the day’s minimum acceptable pace.
On a low-intensity day, a tired morning, in heat or on a difficult course, you may need to run noticeably slower. That does not mean poor execution; it means adjusting external load to achieve the session’s actual purpose.
An easy run is not a fitness demonstration. It accumulates aerobic time and distance at a cost that allows the training week to continue well.
Gradient, heat, wind and terrain
Pace zones assume reasonably comparable conditions. Changing conditions change the pace corresponding to the same effort.
- Uphill, rely more on RPE and, where useful, GAP (Grade Adjusted Pace).
- Accept slower pace into a headwind.
- In heat, adjust before effort exceeds the session’s purpose.
- On trails or technical terrain, prioritise RPE, heart rate and mechanical load.
Do not transfer track pace unchanged to dirt or hills. The zone calculator knows your threshold, not today’s terrain or conditions.
How to check your zones
Do not judge zones from one outstanding or poor day. Look for repeated patterns.
Signs threshold may be overestimated:
- very high RPE from the start of threshold intervals,
- substantial late-repetition pace or form decline,
- easy and aerobic runs consistently harder than intended,
- frequent failure to complete key sessions.
Signs it may be underestimated:
- threshold sessions consistently feeling like controlled tempo,
- little perceived difference between endurance and tempo work,
- repeatedly exceeding zone ranges without a corresponding effort or fatigue increase.
These are indications, not proof. Before changing threshold, check temperature, course, accumulated fatigue, GPS accuracy and whether execution matched the plan.
When to update zones
Recalculate zones:
- after a new reliable race or test result,
- when several sessions show a consistent response change,
- after a training block when reassessment is justified,
- after a long break, illness or return from injury.
One excellent session does not automatically establish a new threshold. Similarly, one poor session may reflect fatigue or difficult conditions rather than reduced fitness.
How to use the Running Pace Zones Calculator
- Establish a suitable threshold pace from a recent race or field test.
- Enter it in the Running Pace Zones Calculator.
- Save the seven zones as a starting point, not inviolable rules.
- Select pace within each range according to session duration, recovery and purpose.
- Combine pace with RPE, breathing and heart rate.
- Adjust for heat, wind, gradients or technical terrain.
- Assess repeated patterns before changing threshold and recalculating zones.
Checklist: am I using pace zones correctly?
- Do I know which model I use?
- Is threshold from a recent reliable test or race?
- Do I apply percentages to speed rather than directly to minutes per kilometre?
- Do I select pace within the zone according to session purpose and duration?
- Do I use RPE, breathing and heart rate as supplementary information?
- Do I adjust pace when conditions change?
- Do I update zones from repeated evidence, not a single day?
Key takeaways
- Pace zones organise training; they do not represent different energy systems.
- “Zone 2” differs between models.
- Every zone depends on threshold-pace accuracy.
- More zones offer detail, not necessarily greater accuracy.
- Pace shows what you did; RPE, breathing and heart rate show its cost.
- Repetition duration, recovery and session purpose define the actual stimulus.
- Easy runs need not always target a zone’s fastest edge.
- Zones change when data change consistently, not with mood or one session.
Sources and further reading
- TrainingPeaks. How to Calculate Threshold Values for Power, Heart Rate, or Pace.
- McGehee JC et al. A comparison of methods for estimating the lactate threshold. Journal of Strength and Conditioning Research. 2005.
- Faude O, Kindermann W, Meyer T. Lactate Threshold Concepts: How Valid Are They? Sports Medicine. 2009.
- Mann T, Lamberts RP, Lambert MI. Methods of Prescribing Relative Exercise Intensity. Sports Medicine. 2013.
- Jamnick NA et al. An Examination and Critique of Current Methods to Determine Exercise Intensity. Sports Medicine. 2020.
- Seiler KS, Kjerland GØ. Quantifying Training Intensity Distribution in Elite Endurance Athletes. Scandinavian Journal of Medicine & Science in Sports. 2006.
- Iannetta D et al. Evaluating the Accuracy of Using Fixed Ranges of METs to Categorize Exertional Intensity. Sports Medicine. 2021.
- El Helou N et al. Impact of Environmental Parameters on Marathon Running Performance. PLOS ONE. 2012.
- Minetti AE et al. Energy Cost of Walking and Running at Extreme Uphill and Downhill Slopes. Journal of Applied Physiology. 2002.
- Lu C et al. Validity of Smartwatch-Derived Estimates of Lactate Threshold Heart Rate and Pace. Frontiers in Physiology. 2025.