A runner completes 5 kilometres in 18:00. With “Conservative bounds” selected, the Threshold & CV Pace Calculator displays:
- Threshold pace:
3:58/km, - Critical Velocity:
3:45/km, - VO₂max pace:
3:34/km.
The numbers are very specific. That does not mean a 5-kilometre race measured three physiological boundaries to the nearest second per kilometre.
The tool instead used performance and age to estimate likely values from other runners with similar performances.
This can be a useful training starting point, but is neither a laboratory test nor a complete Critical Speed curve assessment. First understand what each number represents.
“Threshold” does not always mean the same thing
Research and everyday coaching language use several terms:
- first and second lactate thresholds (
LT1andLT2), - Maximal Lactate Steady State (
MLSS), - Ventilatory Thresholds,
- Critical Speed or Critical Velocity,
- Functional Threshold Pace,
- threshold estimates from races, field tests and wearables.
These may describe fairly similar paces for an athlete, but are not identical. They come from different protocols, definitions and error margins.
Even “lactate threshold” does not identify one measurement method. Many procedures and protocols locate points on the lactate curve. Two tests can therefore give similar threshold paces for one runner and substantially different ones for another. Results always depend on the method and protocol.
In practice, threshold pace usually refers to a pace near the upper limit of prolonged, relatively metabolically steady effort. A maximal pace sustainable for around 45–60 minutes is a common practical approximation, not a universally accepted physiological definition.
Critical Speed and Critical Velocity: one model, two names
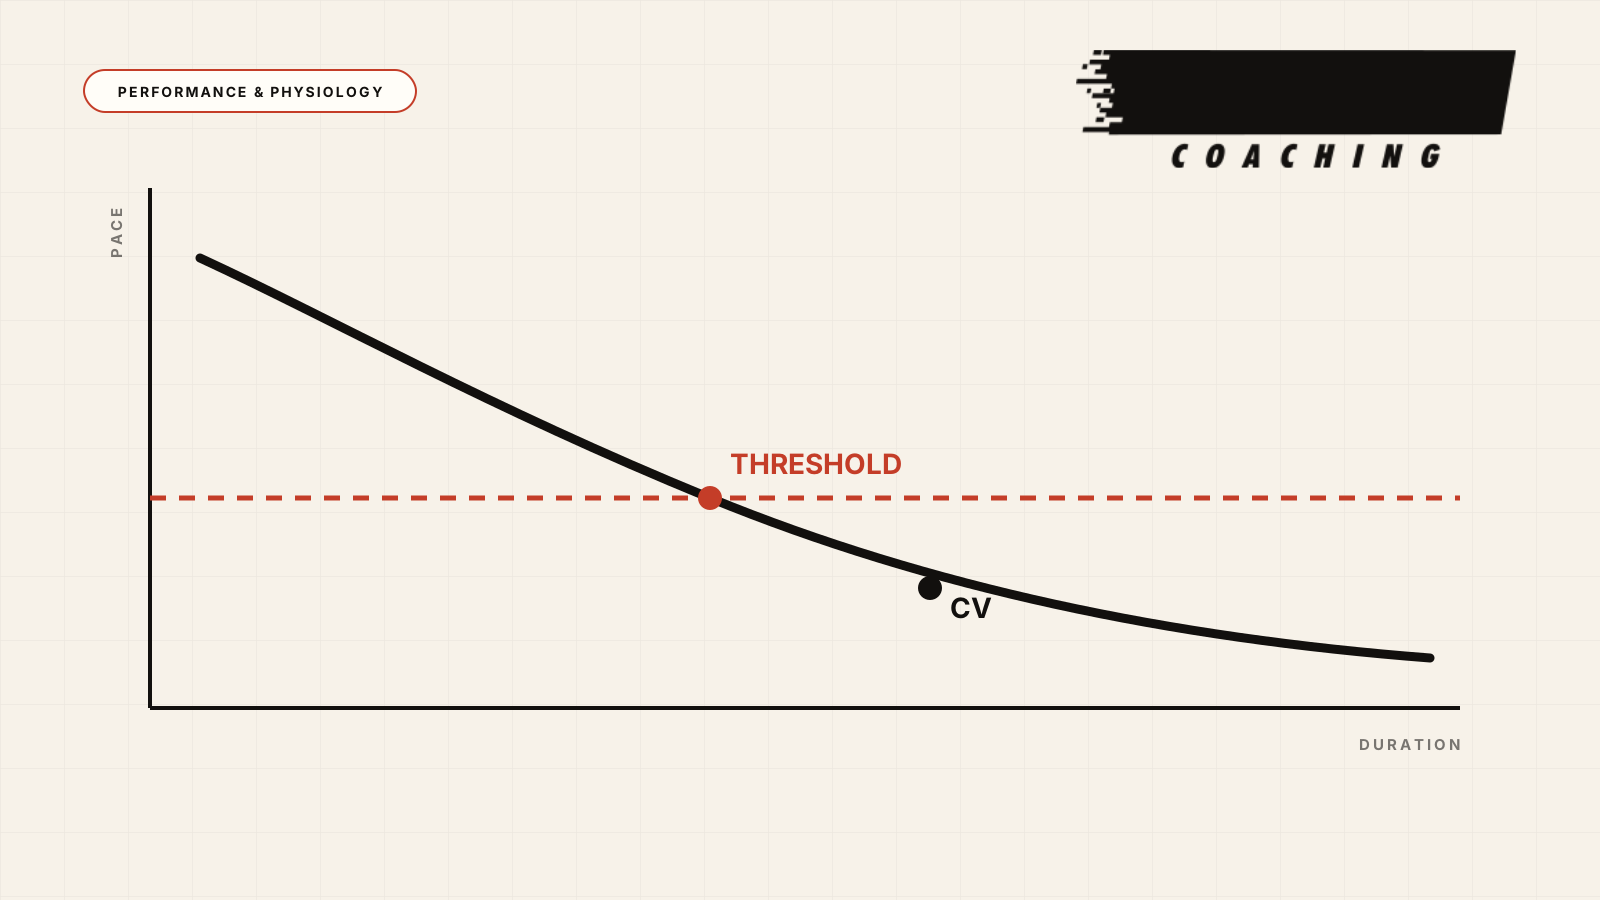
In running, Critical Speed and Critical Velocity usually describe the same concept. The model relates distance covered to maximal-effort duration:
Distance = CS × Time + D′
Where:
CSis Critical Speed: the distance–time line’s slope and the corresponding speed–duration curve’s asymptote,D′is the theoretically finite additional distance an athlete can cover above Critical Speed.
Physiologically, Critical Speed describes the boundary between two intensity domains. Just below it, key metabolic and cardiorespiratory responses can approach steady state. Above it, metabolic disturbance progressively increases until you must slow or stop.
D′ is not a perfectly predictable “anaerobic reserve”. It is a model parameter affected by protocol, pacing, fitness and effort type.
Critical Speed is not “a pace you can hold forever” or a prediction of actual race duration. Tolerance depends on estimation accuracy, daily condition and the conditions during the effort.
One performance cannot establish Critical Speed
An individual distance–time relationship needs more than one point. A single race cannot reliably and independently determine both CS and D′.
Practical field protocols usually use two or three maximal efforts of different durations. Recent literature often uses approximately 3–12 minutes, such as 3, 7 and 12 minutes or equivalent distances. Two efforts define a line; a third helps assess fit to actual data and estimate error.
Efforts must be truly maximal, well paced and performed in comparable conditions. Between-test fatigue, wind, temperature, gradient and distance accuracy can alter results.
This calculator does not request multiple efforts, so it does not fit your personal Critical Speed. It uses a different statistical model to estimate pace ranges associated with your entered race result.
What the Threshold & CV Calculator actually calculates
The tool uses John J. Davis’s open-source model. Its original dataset contains over 8,000 race performances from more than 1,600 runners across around 2,600 racing seasons. Each athlete-season included multiple distances, allowing a Critical Speed curve to be fitted first.
An additive quantile regression model was then trained to estimate the likely Critical Speed distribution from one performance and the runner’s age.
Put simply, the calculator asks:
“Among runners with similar performances, which Threshold, Critical Velocity and VO₂max pace ranges best match this result?”
It does not know:
- your lactate curve,
- running economy,
- actual
D′, - whether you are more
speed-orientedorendurance-orientedthan comparable runners in the dataset, - how well you paced the race,
- whether heat, wind, elevation or fatigue affected performance.
Results therefore include an uncertainty range and should not be treated as personal physiological measurements.
Threshold, CV and VO₂max pace are not three independent measurements
This is the most important point for interpreting the result.
In this model, the three paces come from different parts of the estimated distribution around Critical Speed:
Threshold paceuses the more conservative, slower side, where metabolically steady effort is more likely to be sustainable.Critical Velocityis the central Critical Speed estimate, around the boundary between metabolically steady and non-steady effort.VO₂max paceuses the faster side, where effort is more likely to progress towards maximal oxygen uptake and exhaustion.
These terms help apply results in training. They do not mean one race separately measured LT2, Critical Speed and vVO₂max.
This explains why Threshold can be noticeably slower than CV. The tool does not claim two independent thresholds; it shows different pace values accounting for uncertainty in the speed–duration relationship.
Why race distance changes uncertainty
Runners with identical 800 m times can have very different aerobic capacities. One may rely more on speed and anaerobic contribution, another on aerobic endurance. An 800 m or 1500 m therefore leaves greater threshold-prediction uncertainty.
A recent 3K or 5K usually produces less error because:
- aerobic contribution dominates,
- duration remains relatively close to the model’s development range,
- pure top-end speed has less influence,
- the training dataset contains sufficient relevant performances.
A 10K can be used, but longer duration increases the importance of specific endurance, pacing, temperature and intensity tolerance. The same 10K time need not imply the same Threshold–CV relationship for everyone.
A key limitation for recreational runners is the documented performance range: approximately 14:00–25:00 for 5K. Data—and therefore reliability—are more limited for slower performances. Do not use the tool for arbitrary extrapolation beyond this range.
For greater accuracy:
- Prefer a recent 3K–5K race or reliable time trial.
- Use a flat, accurately measured course.
- Avoid results from extreme heat or strong wind.
- Confirm maximal effort and good pacing.
- Do not use an old personal best that no longer reflects your condition.
Conservative bounds or Central estimate: different ways to handle error
Central estimate uses the model’s central statistical estimate. It shows the middle of the pace distribution for runners with similar performances.
Conservative bounds uses the slower Threshold boundary and faster VO₂max pace, while CV remains at the central estimate. This creates greater separation between training intended to stay metabolically controlled and training intended to clearly enter a non-steady metabolic response.
Conservative bounds is not necessarily more accurate. It is a more conservative way to handle potential error within this model’s distribution, not a guarantee that every athlete reaches the intended intensity domain.
Use Conservative bounds by default when:
- starting a new training block,
- returning after a break or illness,
- using an 800 m or 1500 m result,
- paces are not yet confirmed in training,
- you tend to turn threshold sessions into maximal or near-maximal efforts.
The central estimate becomes more useful when recent data and multiple sessions show a normal, expected response at that pace.
Turning estimates into training pace zones
A calculator output is not a workout in itself. Actual load depends on:
- repetition duration,
- total time at pace,
- recovery duration and type,
- previous days’ training load,
- course and weather.
Depending on level and preparation phase, a recreational runner’s threshold session might include 3×8–10 minutes or 4–5×5–6 minutes with short easy-jog recovery. Total quality time might initially be around 20–30 minutes, increasing only while execution stays controlled.
You need not hit the displayed pace exactly every repetition. Start near the conservative estimate or slightly slower and assess overall response and effort.
CV is a higher, less predictable intensity region. It can suit shorter repetitions for a prepared athlete, but should not automatically replace threshold. Near or above estimated Critical Speed, duration and recovery increasingly determine whether the session stays controlled or becomes excessively demanding.
This applies even more to VO₂max pace. Near maximal oxygen uptake, repetition duration and recovery strongly affect actual load. The calculator’s number is not automatically the right pace for every VO₂max workout.
How to check whether paces are appropriate
In a well-designed threshold session, we usually want:
- elevated but controlled breathing,
- a small, progressive RPE increase,
- steady pace without major late-repetition decline,
- maintained running technique,
- completion without sprinting or total exhaustion,
- a normal return to training over subsequent days.
If the first repetition already feels too intense and later ones progressively slow, threshold pace may be too fast, recovery too short or total session duration beyond current fitness.
If repetitions are very easy, first check whether recovery is too long or effort duration insufficient. Do not automatically speed up after one easy completion.
In heat, uphill, into a headwind or on difficult terrain, allow slower pace while preserving the session’s purpose and effort. The calculator knows a race result, not today’s weather.
When reassessment is needed
Recalculate estimates:
- after a new reliable race or time trial,
- after a training block with evidence of progress,
- when multiple sessions consistently show a different response,
- after a long break, illness or return from injury.
Do not test weekly or change pace after one excellent or poor day. Daily variability, fatigue and conditions can cause larger changes than actual fitness development.
How to use the Threshold & CV Pace Calculator
- Choose a recent maximal result from 800 m to 10K, preferably 3K–5K.
- Check that equivalent 5K performance is near
14:00–25:00. - Start with
Conservative boundswhen prescribing training. - Display uncertainty, not just the central number.
- Treat Threshold pace as indicative, not mandatory.
- Assess sessions with RPE, breathing, heart rate and technique.
- Enter confirmed threshold in the Running Pace Zones Calculator and read Running Pace Zones for correct use.
Checklist: can I trust the estimate?
- Is the performance recent and truly maximal?
- Was the course flat and weather favourable?
- Is the input preferably from 3K or 5K?
- Are you within the documented lower-error range,
5K in 14:00–25:00? - Have you viewed the full uncertainty range?
- Are
Conservative boundstreated as a conservative prediction, not a guarantee? - Have you adapted pace to duration, recovery and session purpose?
- Is the pattern confirmed across multiple sessions?
Key takeaways
Thresholdhas no single universally accepted definition.- In running, Critical Speed and Critical Velocity describe the same scientific model.
- Personal Critical Speed fitting needs multiple maximal efforts; one performance gives a population-based prediction.
- The calculator’s Threshold, CV and VO₂max paces estimate different parts of a distribution around Critical Speed, not three independent physiological measurements.
Conservative boundsreduces model-based risk of excessively fast pacing but cannot guarantee correct intensity for every athlete.- 3K–5K results usually work better than 800 m; reliability declines outside the documented
5K in 14:00–25:00range. - Pace only becomes meaningful alongside duration, recovery, RPE, weather and total training load.
- Training gradually supports the estimate; it does not make it certain.
Sources and further reading
- Poole DC et al. Critical Power: An Important Fatigue Threshold in Exercise Physiology. Medicine & Science in Sports & Exercise. 2016.
- Jones AM et al. The maximal metabolic steady state: redefining the “gold standard”. Physiological Reports. 2019.
- Nixon RJ et al. Steady-state VO₂ above MLSS: evidence that critical speed better represents maximal metabolic steady state in well-trained runners. European Journal of Applied Physiology. 2021.
- Faude O, Kindermann W, Meyer T. Lactate Threshold Concepts: How Valid Are They? Sports Medicine. 2009.
- Jamnick NA et al. An Examination and Critique of Current Methods to Determine Exercise Intensity. Sports Medicine. 2020.
- Galbraith A et al. A single-visit field test of critical speed. International Journal of Sports Physiology and Performance. 2014.
- Kranenburg KJ, Smith DJ. Comparison of critical speed determined from track running and treadmill tests in elite runners. Medicine & Science in Sports & Exercise. 1996.
- Lipková L et al. Field-based tests for determining critical speed among runners and its practical application: a systematic review. Frontiers in Sports and Active Living. 2025.
- John J. Davis. Threshold, CV and VO₂max Pace Calculator — methodology and limitations.
- John J. Davis. Open-source calculator, dataset and analysis code.