Suppose your session includes 6×1000 m, targeting 3:10 per repetition. The final kilometre time is clear. What it does not show is how to get there.
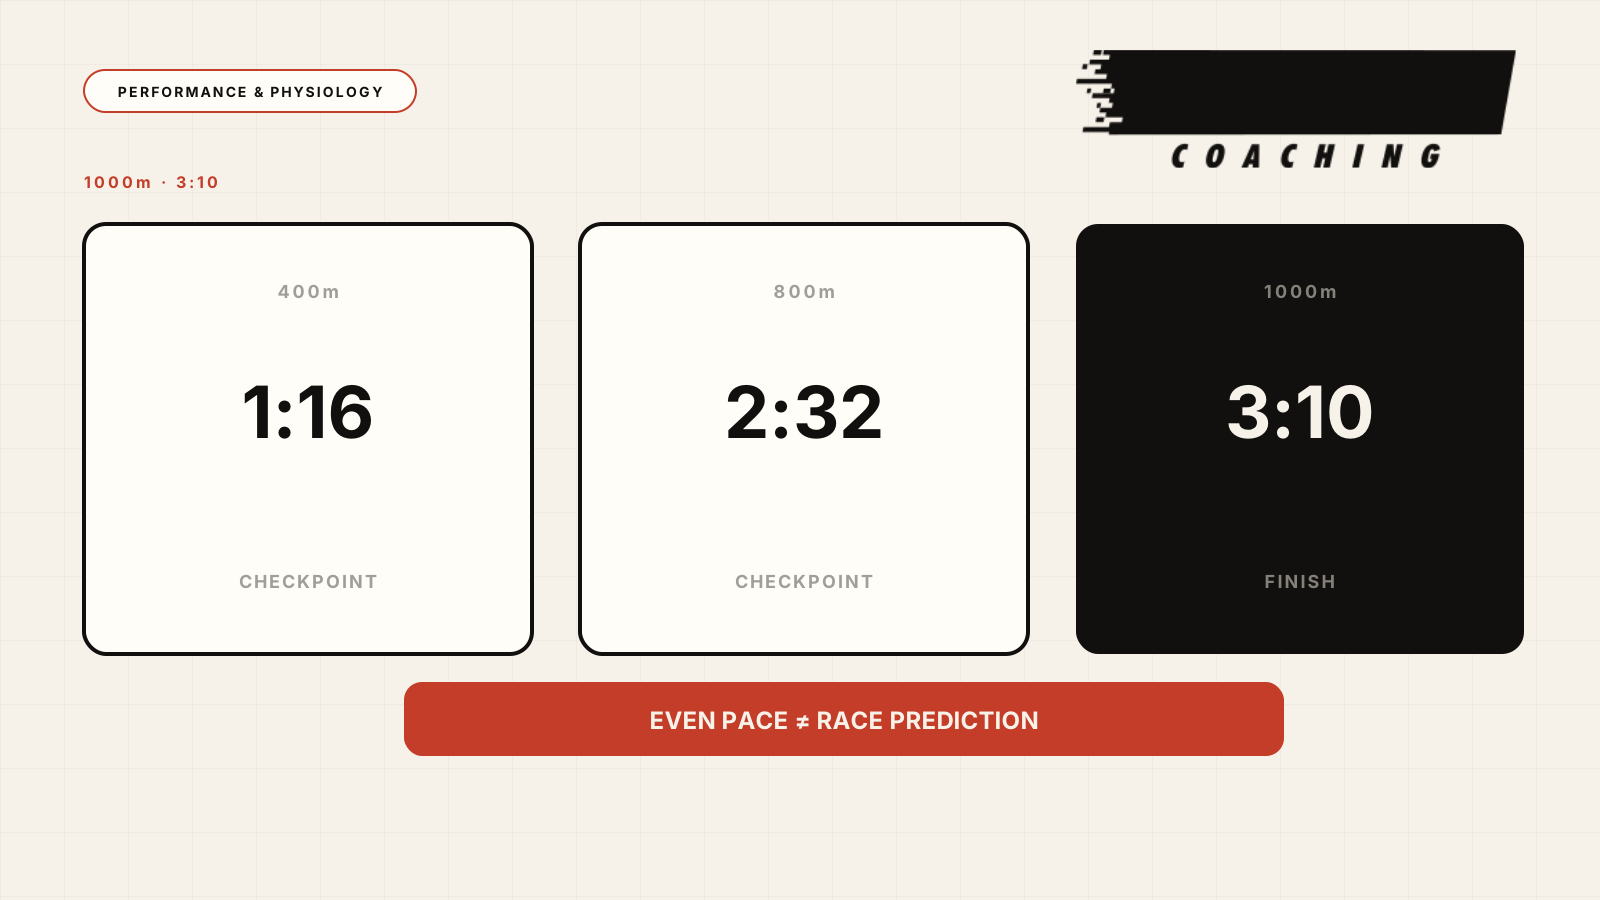
At even pace, checkpoints are 1:16 at 400 m and 2:32 at 800 m. One athlete can follow these splits and finish under control. Another might run the first 400 m in 1:11, reach 800 m in 2:28 and slow sharply over the final 200 m. Both could finish in 3:10, but they would have executed different sessions.
This is a pace chart’s main value: it does more than give a final time. It turns the target into checkpoints for assessing effort distribution.
What a pace chart actually calculates
The calculation starts with two inputs:
- reference distance,
- time for that distance.
These give average pace:
pace = time ÷ distance
Time for every other distance is then calculated at exactly the same pace:
equivalent time = pace × new distance
“Equivalent” means the new time corresponds to exactly the same average speed. It does not mean an expected race performance.
If you run 400 m in 70 seconds, the calculation can extend that speed to 5K or a marathon. The arithmetic is correct, but assuming you can sustain it for so much longer is physiologically unrealistic.
The Pace Chart Calculator is therefore a constant-pace tool, not a race predictor. To estimate a possible finish time at another distance, use the Race Predictor, which accounts for decreasing speed as distance grows. Even then, the result is an estimate, not a guarantee.
Example: 1000 m in 3:10
A time of 3:10 equals 190 seconds. Since the distance is exactly 1 km, average pace is 3:10/km.
| Distance | Time at constant pace |
|---|---|
| 400 m | 1:16 |
| 600 m | 1:54 |
| 800 m | 2:32 |
| 1000 m | 3:10 |
| 1200 m | 3:48 |
| 1600 m | 5:04 |
| 3K | 9:30 |
| 5K | 15:50 |
Every time in the table is correct under the same assumptions: no speed change and no intermediate rounding. They do not all have the same practical meaning.
The 400, 600 and 800 m times are useful checkpoints within a 1000 m repetition. The 1200 and 1600 m times help with longer repetitions at the same pace. The 15:50 for 5K simply shows the mathematical time at that speed over 5 km. It does not prove you can sustain it in a 5K race.
Cumulative splits show how you execute the effort
A cumulative split is total elapsed time from the start to a checkpoint. For 1000 m in 3:10, the cumulative splits are:
- 400 m: 1:16,
- 800 m: 2:32,
- 1000 m: 3:10.
Seeing 1:12 for the first 400 m does not mean you have “gained” four seconds. You have started faster than target and changed effort distribution. If you reach 3:10 by slowing substantially, you have met the time but not necessarily the session’s purpose.
Intermediate splits help answer three questions:
- Did I start faster than target pace?
- Did I maintain pace through the middle?
- Did the final time come from controlled effort distribution, or an aggressive start followed by marked slowing?
In threshold, VO₂max and race-pace sessions, this is often more valuable than a fast final 100 m that corrects the repetition’s average time.
The same pace does not always mean the same training stimulus
A pace chart describes external load: distance and time. It does not know your level, session purpose or overall set structure.
The same 1000 m in 3:10 could be a controlled threshold interval for one athlete, near-VO₂max work for another or almost maximal for a less-trained runner.
Training stimulus also depends on:
- number of repetitions,
- recovery duration and type,
- training status and accumulated fatigue,
- temperature, wind, gradient and surface,
- effort and technique in the final repetitions.
For example, 6×1000 m with 60 seconds of easy jogging differs from 6×1000 m with three minutes of full recovery, even if every repetition takes 3:10.
Assess splits alongside the set’s purpose, perceived exertion (RPE), recovery duration and execution quality.
Even pace is a reference, not necessarily the best strategy
Even pace means constant average speed across selected sections. It does not require identical instantaneous speed every second.
You must accelerate from a standing start. Road races involve turns, elevation changes, wind, aid stations and congestion. Track races can involve position changes, tactics and a finishing sprint.
Research shows that speed distribution depends on duration, tactics and race context. An even-pace chart is a neutral baseline: first understand steady splits, then decide whether there is a real reason to deviate.
To plan a deliberate negative split or different paces for individual sections, use the Split Calculator. The pace chart provides the steady baseline for your race plan.
Rounding can accumulate small calculation errors
The calculator keeps full internal precision and rounds only each distance’s final time to the nearest second. This matters when an ideal split includes decimals.
For 10K in 41:10, the exact 400 m split is 98.8 seconds, displayed as 1:39. Repeating 1:39 mechanically for 25 laps gives 41:15—five seconds slower than target.
Each rounded 400 m looks right, but the small remainder accumulates. For longer efforts, also check cumulative points such as 1 km or 5K rather than multiplying a single rounded split.
On the track, trust known distances
The calculator assumes exact distances. On a standard track, 400 m is measured along the designated measurement line in lane one. Running in an outer lane without the appropriate staggered start covers more distance.
Use official track markings and cumulative splits as your main reference. Instantaneous GPS pace can err on bends and is not more accurate than a known, correctly measured distance.
How to use the Pace Chart Calculator
- Select the
DISTANCEmatching your actual training instruction or race target. - Enter
TIME FOR SELECTED DISTANCE. - Check
PACEper kilometre. - From
TIME (EVEN-PACE), choose two or three useful checkpoints. - Use
Copy Chartto transfer times into a workout description or notes. - Assess execution alongside RPE, technique and planned recovery.
For 6×1000 m in 3:10, you need not memorise the table through to the marathon. Keep only useful checkpoints: 1:16 at 400 m, 2:32 at 800 m and 3:10 at the end.
Key takeaways
- A pace chart converts a time into equivalent times at exactly the same pace.
- It does not predict performance at another distance or know your endurance and preparation.
- Cumulative splits reveal how you reached the final time, not just whether you achieved it.
- The same time can represent different stimuli for different athletes or session structures.
- Even pace is a useful reference, but not always the right race strategy.
- Over long distances, use longer cumulative checkpoints to limit rounding errors.
Final time shows whether you met the numerical target. Intermediate splits show how you got there—and that is often more useful for assessing training.
Sources and further reading
- de Koning JJ, Foster C, Bakkum A, et al. Regulation of pacing strategy during athletic competition. PLOS ONE. 2011;6(1):e15863.
- Gosztyla AE, Edwards DG, Quinn TJ, Kenefick RW. The impact of different pacing strategies on five-kilometer running time trial performance. Journal of Strength and Conditioning Research. 2006;20(4):882–886.
- Hanley B, Stellingwerff T, Hettinga FJ. Successful pacing profiles of Olympic and IAAF World Championship middle-distance runners across qualifying rounds and finals. International Journal of Sports Physiology and Performance. 2019;14(7):894–901.
- World Athletics. Competition and Technical Rules — 2026 Edition.
- World Athletics. Track and Field Facilities Manual 2019 — 400 m Standard Track geometry.