Suppose you produce 400 W for 3 minutes and 320 W for 12 minutes in two maximal efforts. The Critical Power Calculator uses these results to estimate Critical Power at around 293 W and W′ at around 19.2 kJ.
These numbers describe different things. Critical Power (CP) is the value that maximal power approaches as effort duration increases. W′ describes the finite additional work that can be produced above CP. For these values to be useful, the efforts you enter must be properly executed and the results used within the model’s limits.
The power–duration curve is not linear
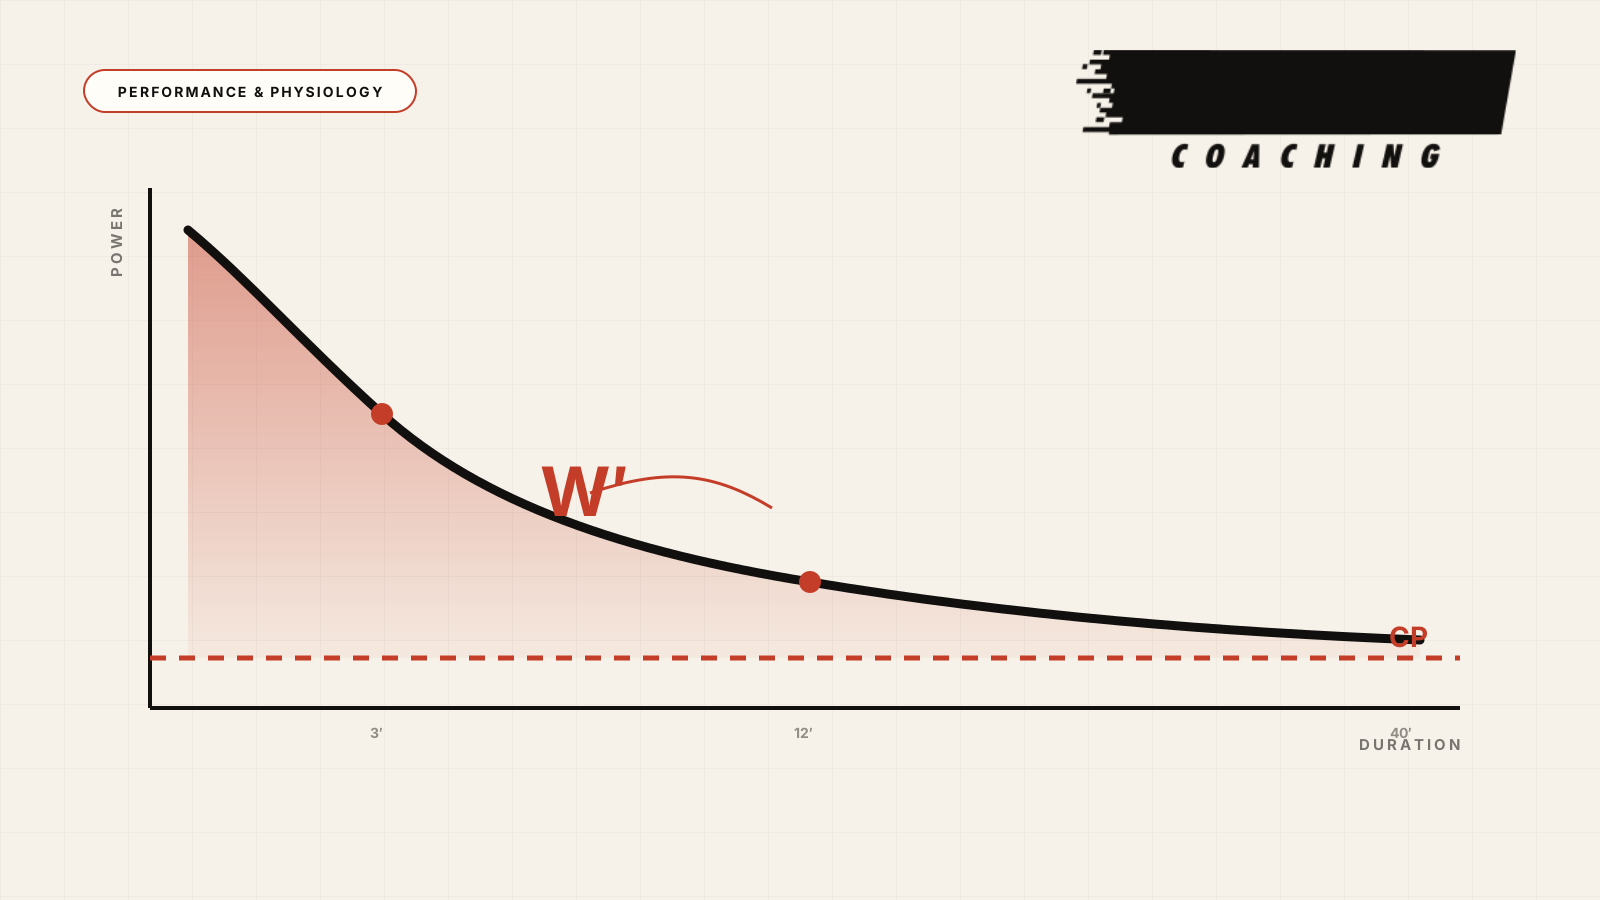
As a maximal effort becomes longer, the average power you can sustain decreases. The decline is not constant: it is much greater at short durations and gradually becomes smaller as duration increases.
The two-parameter Critical Power model describes this relationship with the equation:
P = CP + W′ / t
where:
Pis maximal average power for a given duration,tis duration in seconds,CPis Critical Power in watts,W′is the finite work capacity above CP, in joules.
In the example above, 293 W and 19.2 kJ predict around 357 W for a maximal 5-minute effort:
293 + 19.200 / 300 ≈ 357 W
The calculation is correct within the model, but it does not guarantee that you will actually sustain 357 W in a 5-minute test.
What Critical Power represents
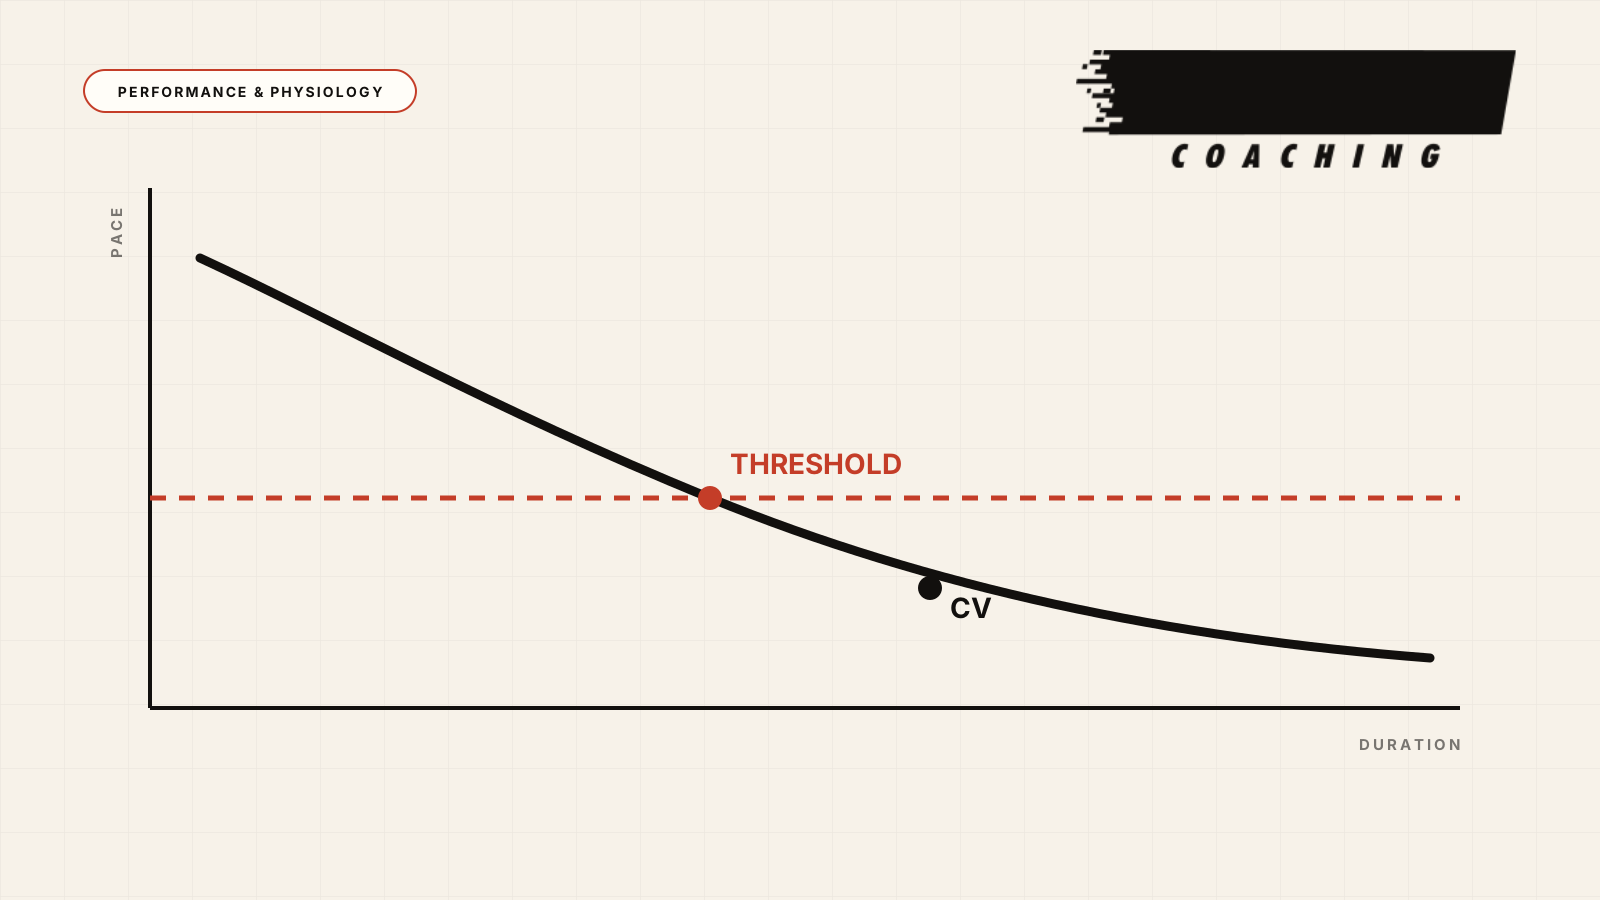
CP is the asymptote of the power–duration curve and lies around the boundary between the heavy and severe intensity domains.
Below CP, oxygen consumption and other physiological responses can stabilise under suitable conditions. Above CP, the disturbance continues to increase, VO₂ rises towards VO₂max and the effort eventually ends in exhaustion.
This does not mean CP can be sustained indefinitely. How long you can actually hold power near CP depends on the protocol, training status, fatigue and conditions.
W′ is not an energy tank
W′ is expressed in joules or kilojoules and describes your finite capacity to produce work above CP. The further you exceed CP, the faster this capacity is used and your “energy tank” empties.
W′ has practical relevance to efforts such as a short climb, an attack or an intense interval session. Two cyclists can have the same CP but different W′ values, and differ in their tolerance of efforts lasting several minutes above it.
However, do not treat W′ as a literal tank or a direct measurement of anaerobic energy and capacity. It is a model parameter influenced by several physiological processes and the estimation protocol.
The simple two-parameter model describes continuous maximal efforts. W′ balance models attempt to estimate W′ expenditure and recovery during intervals, but recovery rates differ between people and do not remain constant as fatigue accumulates.
How to choose your test efforts
The calculator accepts two to four maximal efforts of different durations. Two efforts provide an exact mathematical solution for the two unknown parameters. With three or four efforts, it uses linear regression of average power against 1/t to estimate CP and W′ from the full set of results.
To cover the curve better, use at least three efforts:
- A short effort of 2–5 minutes.
- A medium effort of 6–9 minutes.
- A longer effort of 10–15 minutes.
A practical example is 3, 7 and 12 minutes. The short effort has more influence on W′, while the longer effort helps locate CP more accurately. Durations that are too close together can produce less stable estimates, even when the model fits the data.
Each effort should aim for the highest average power you can sustain for its entire duration. Do not sprint through the first minute and then collapse. The separate 3-minute all-out test is a different protocol and is not the one this calculator uses.
Data quality determines the result
To compare test results, including future retests:
- use the same power meter or smart trainer,
- follow the manufacturer’s calibration or zero-offset instructions,
- perform the efforts rested and with adequate carbohydrate availability,
- keep position, cadence, cooling and conditions similar,
- allow enough recovery for every effort to be truly maximal,
- use efforts you are already familiar with.
Tests can take place on separate days or in a properly organised single session with long recovery intervals. Do not enter a result as maximal if it was compromised by prior fatigue, poor pacing or inadequate cooling.
With at least three points, R² indicates how well the data fit the line. It does not prove that the efforts were truly maximal or that predictions are accurate. With two points, the fit is necessarily perfect and offers no independent check of its quality.
Why Critical Power is not the same as FTP
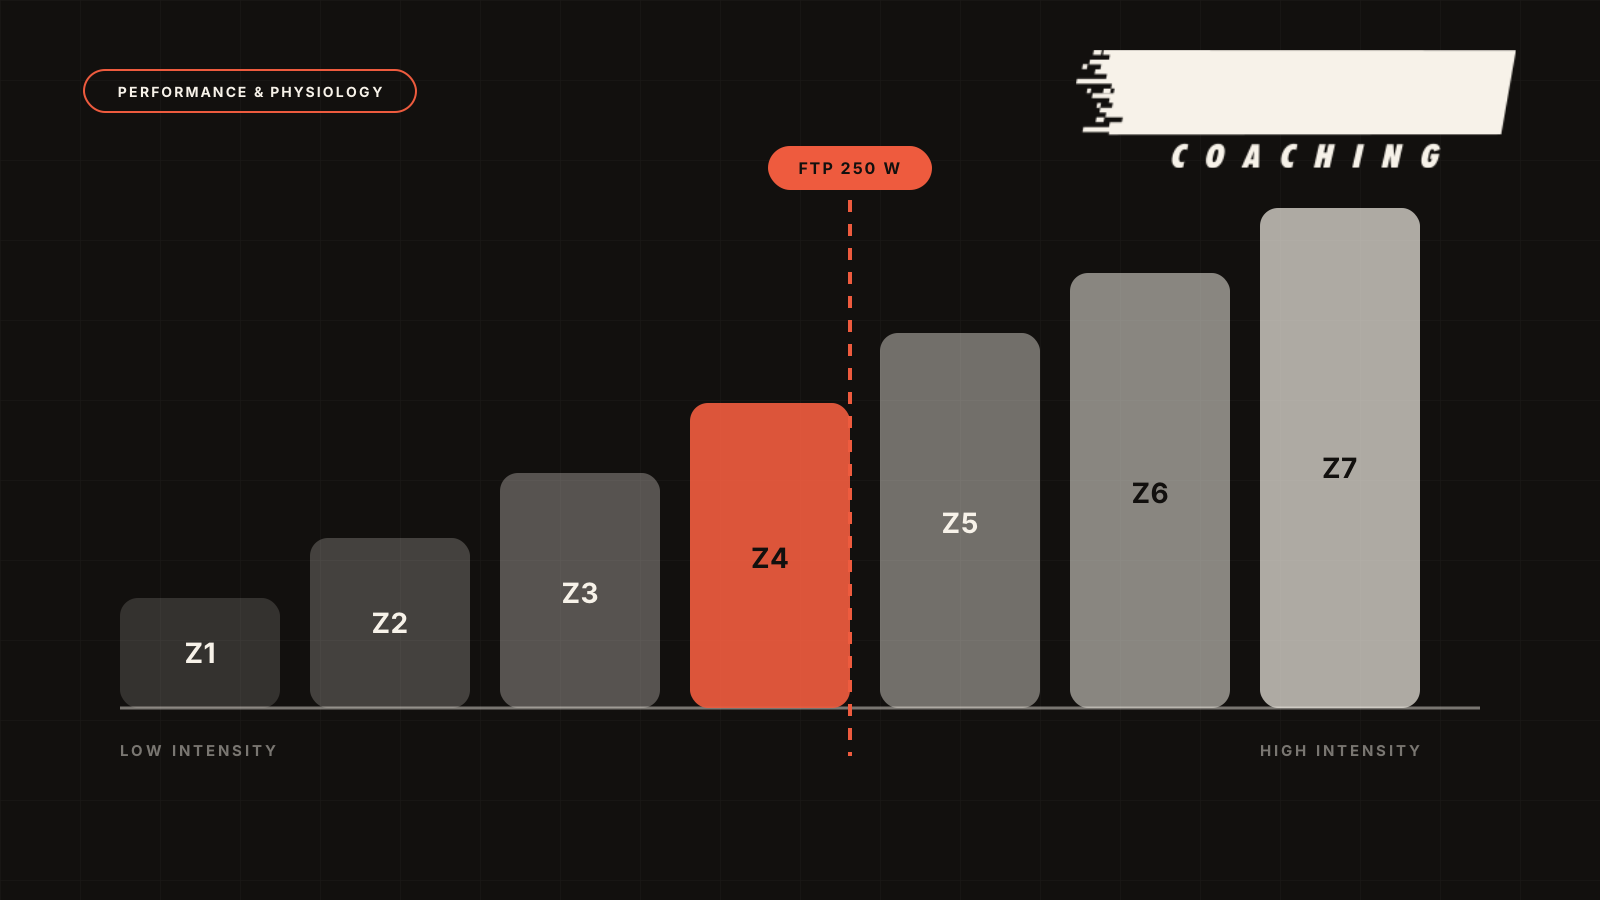
CP comes from the power–duration model and multiple maximal efforts. FTP is usually estimated using a different protocol, such as 95% of average power in a 20-minute time trial, and is mainly used as a practical reference for watt-based zones.
The values are often close, but that does not make them identical. In a study of 17 trained cyclists and triathletes, CP averaged 7 W above FTP, with substantial individual differences. We should therefore not assume that the terms describe the same thing or that the values are interchangeable.
To organise zones from an FTP test, use the Cycling Power Zones Calculator. To describe your maximal power–duration curve using CP and W′, use the Critical Power Calculator. They answer different questions.
Predictions have specific limits
The calculator can estimate:
- maximal power for a given duration,
- the duration predicted by the model for power above CP.
Predictions are more useful near the range of efforts you entered. A model based on 3–12-minute efforts cannot predict a 30-second sprint or a one-hour time trial with the same reliability.
Duration is predicted using the equation:
t = W′ / (P − CP)
As power approaches CP, the denominator becomes very small, and a difference of just a few watts substantially changes the predicted time. The equation therefore cannot reliably predict duration exactly at CP or just above it. Research in trained cyclists also found that prediction accuracy differed between very short and prolonged efforts.
How to use CP and W′ in training
These parameters help build a training profile; they are not simply two numbers that must always increase together.
- Increasing CP raises the power you can produce during prolonged, intense efforts.
- A change in W′ has more influence on tolerance and duration above CP.
- Together, they help organise severe-domain intervals around power, duration and recovery.
- Successive tests show whether the main change was in sustained power, capacity above CP or both.
A calculator output is not a workout in itself. A session at 110% of CP has no fixed difficulty without considering duration—and therefore total work above CP—recovery, fatigue and the athlete’s response.
What the numbers mean for triathlon
In long races, average bike power is usually well below CP. A wattage target must account for race duration, the athlete’s profile, the course, heat, fuelling and the run that follows.
Shorter races or steep climbs may involve brief periods above CP. W′ explains their cost, but that does not mean you can treat every climb as a maximal effort. Modelled W′ recovery below CP is imperfect and depends on intensity, duration and accumulated fatigue.
In triathlon, CP and W′ therefore help explain the athlete’s power profile, control surges and plan training. They do not replace a complete race plan that also preserves the legs for the run.
Key takeaways
- Critical Power and W′ are the two parameters of a power–duration model.
- CP lies around the heavy–severe intensity boundary, but is not power you can sustain indefinitely.
- W′ describes finite additional work capacity above CP, not a literal energy tank.
- CP and FTP may be close, but are calculated differently and should not be treated as identical.
- Maximal efforts, pacing, recovery and power-meter reliability determine result quality.
- Predictions are most useful within or near the test range and become extremely sensitive as power approaches CP.
- In triathlon, the model helps assess power profile and the cost of race surges, but does not determine race strategy or intensity on its own.
Use the Critical Power Calculator with two to four maximal efforts of different durations. For a better estimate, include at least one short, one medium and one longer effort, and assess the result alongside the quality of test execution.
Sources and further reading
- Poole DC, Burnley M, Vanhatalo A, Rossiter HB, Jones AM. Critical Power: An Important Fatigue Threshold in Exercise Physiology. Medicine & Science in Sports & Exercise. 2016;48(11):2320–2334.
- Jones AM, Vanhatalo A. The Critical Power Concept: Applications to Sports Performance with a Focus on Intermittent High-Intensity Exercise. Sports Medicine. 2017;47(Suppl 1):65–78.
- Chorley A, Lamb KL. The Application of Critical Power, the Work Capacity above Critical Power (W′), and Its Reconstitution: A Narrative Review of Current Evidence and Implications for Cycling Training Prescription. Sports. 2020;8(9):123.
- Karsten B, Petrigna L, Klose A, et al. Relationship Between the Critical Power Test and a 20-min Functional Threshold Power Test in Cycling. Frontiers in Physiology. 2021;11:613151.
- Triska C, Karsten B, Heidegger B, et al. Reliability of the Parameters of the Power-Duration Relationship Using Maximal Effort Time-Trials Under Laboratory Conditions. PLOS ONE. 2017;12(12):e0189776.
- Pallarés JG, Lillo-Beviá JR, Morán-Navarro R, et al. Time to Exhaustion During Cycling Is Not Well Predicted by Critical Power Calculations. Applied Physiology, Nutrition, and Metabolism. 2020;45(7):753–760.