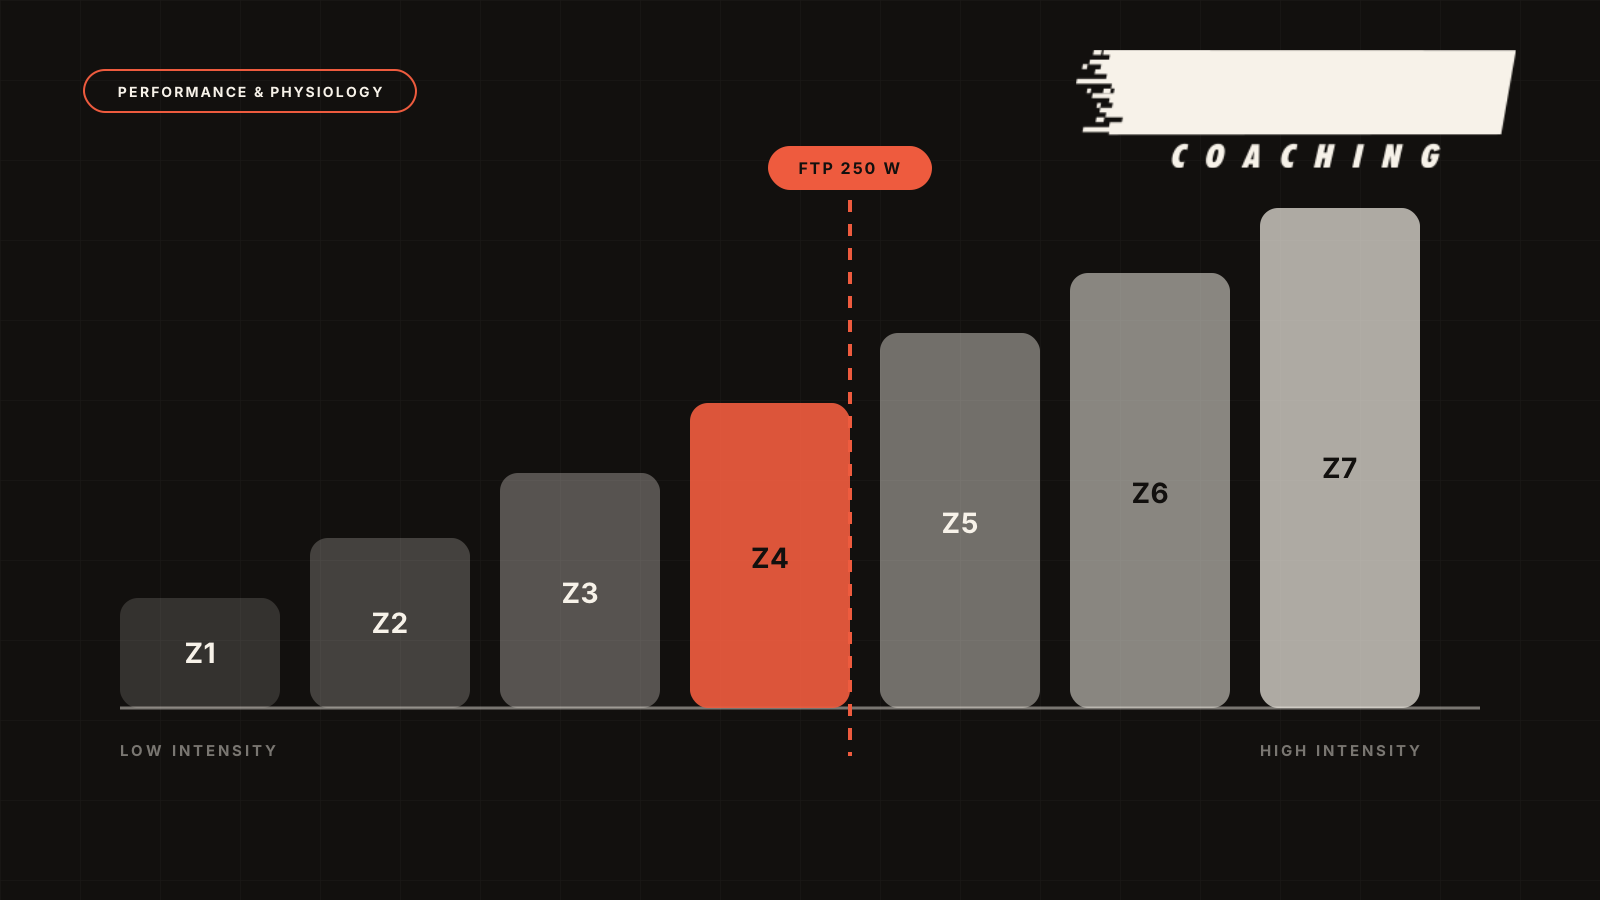
Suppose your FTP is 250 W. With the 7-zone system selected, the Cycling Power Zones Calculator gives an Endurance zone of 139–188 W and a Threshold zone of 226–263 W.
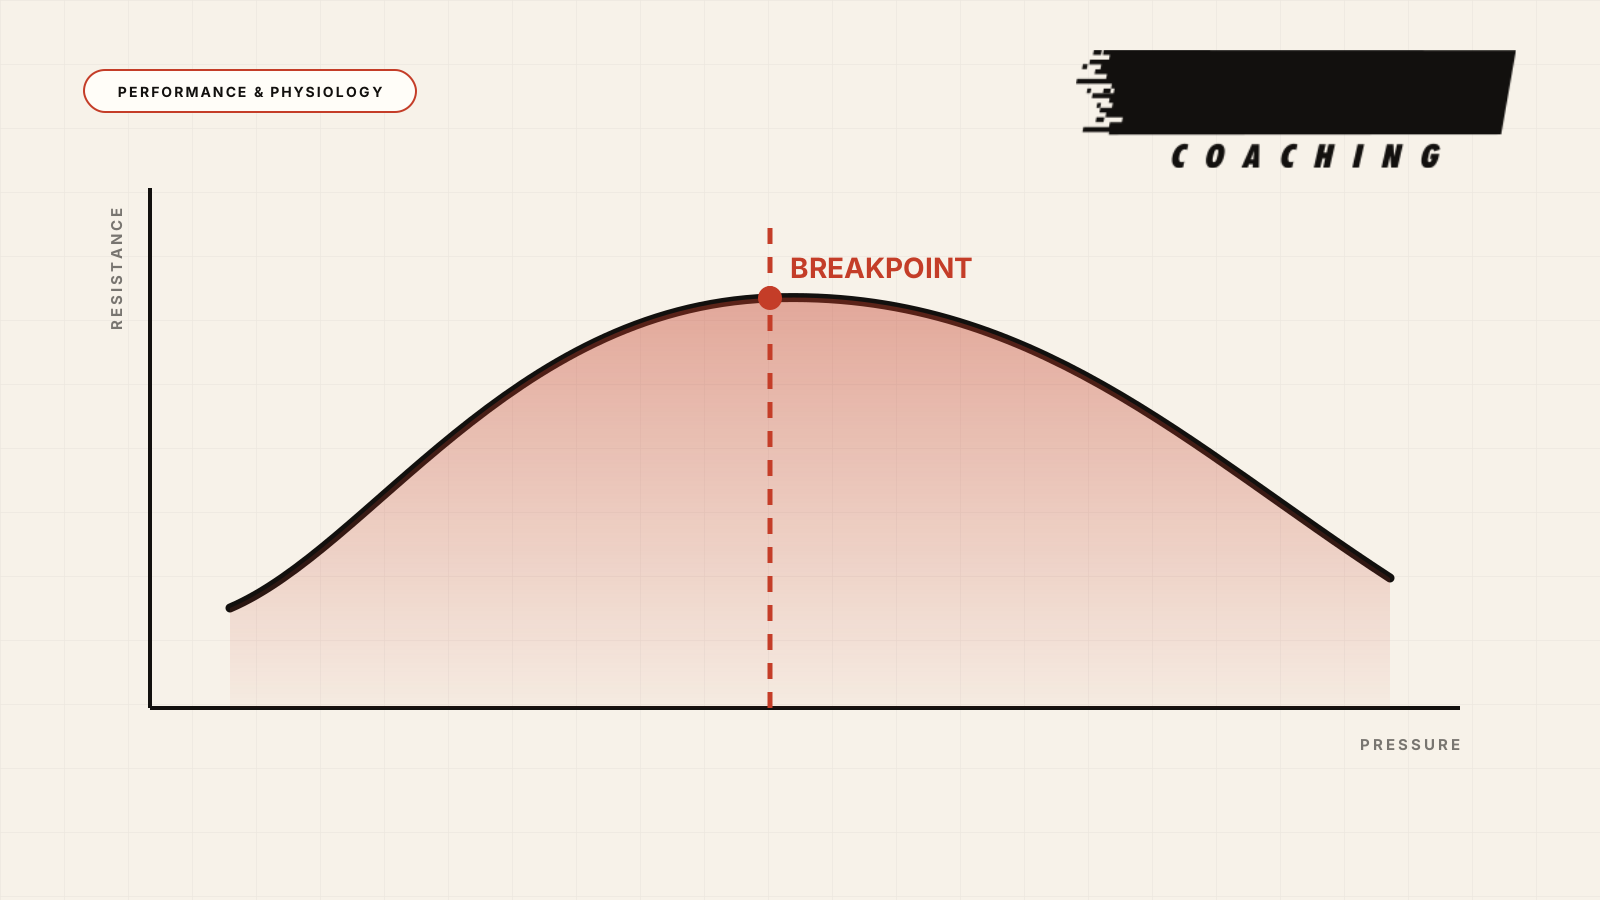
These numbers are correct for the model’s percentages. But that does not mean 188 W creates the same load as 139 W over several hours, or that at 264 W your body suddenly switches to an entirely different energy system.
Power zones help organise training around a common reference. They are not seven separate physiological states, but a practical way to interpret watts. Your zones are only as reliable as the FTP used to calculate them.
What the Cycling Power Zones Calculator actually does
The calculator accepts a known FTP or average power from a maximal 8-, 20-, 30- or 60-minute test. It applies the corresponding factor and converts the result into 3, 5 or 7 training zones. Entering body weight also calculates FTP in W/kg, without changing the watt-based zones.
It precisely answers “what are this model’s boundaries for an FTP of 250 W?” It cannot know whether your test was well executed, your power meter measures accurately or your physiology fits the general percentages used.
FTP is a practical reference, not a laboratory-measured threshold
Functional Threshold Power is commonly used as a practical estimate of the highest power you can sustain for around an hour in a relatively steady maximal effort. In practice, it is often estimated from shorter tests rather than an actual 60-minute time trial.
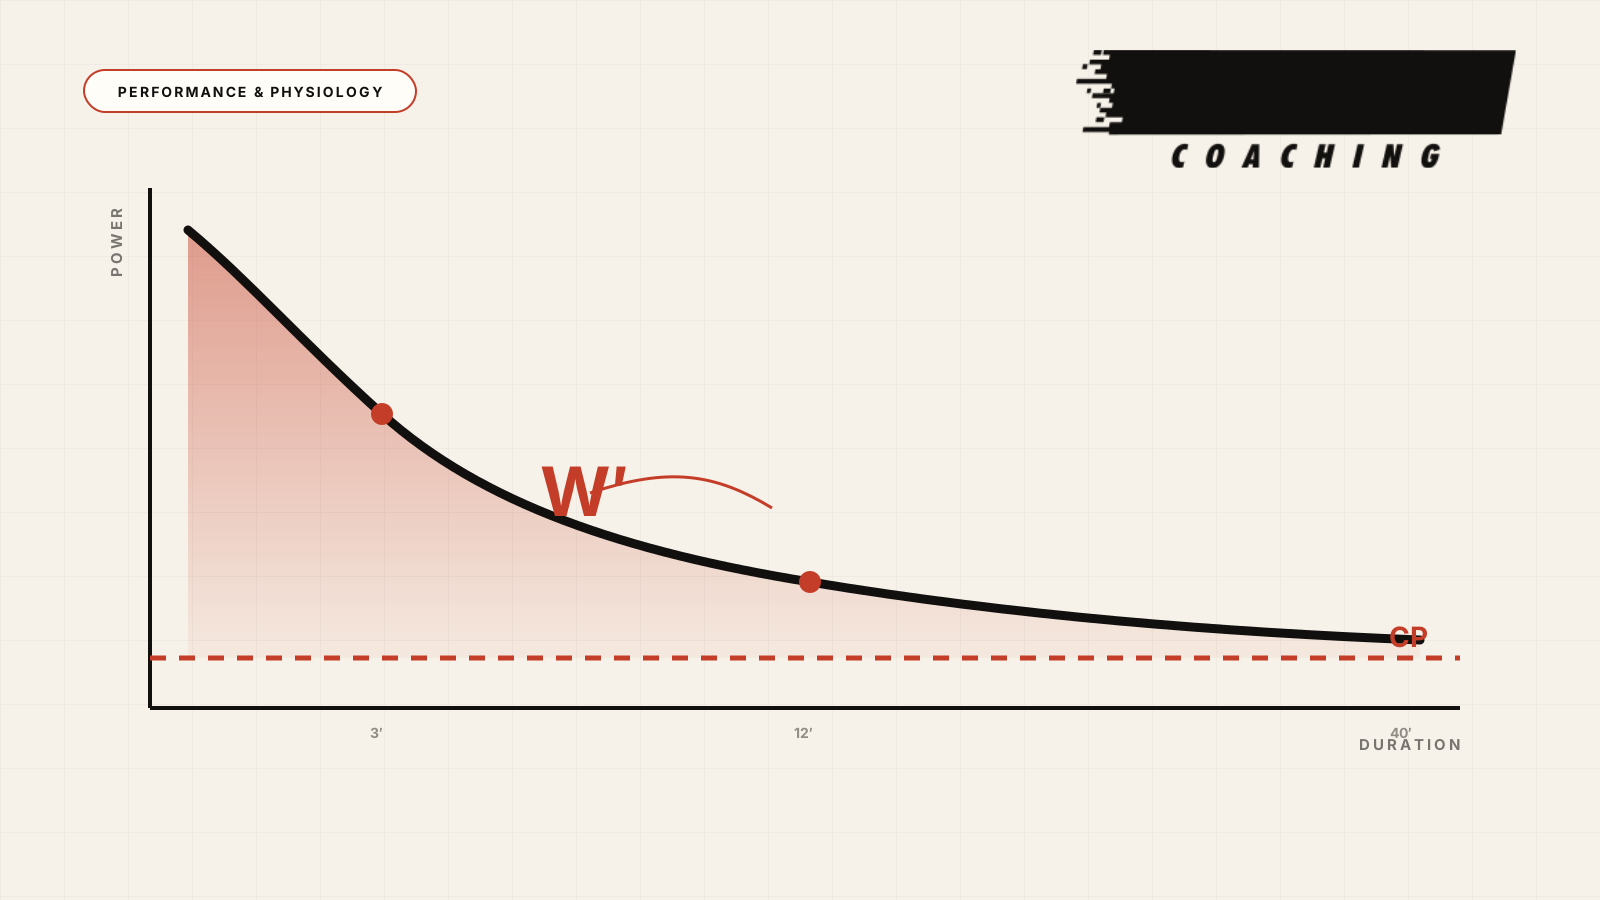
Maximal average power for a given duration, FTP from a particular protocol and physiological boundaries such as Maximal Lactate Steady State or Critical Power are different concepts. They may correlate closely across a group, but are not automatically identical for each athlete. In a study of 23 trained cyclists, time to exhaustion at FTP estimated as 95% of a 20-minute test averaged 50.9 minutes, with substantial individual variation.
FTP is a useful, repeatable training number. It is not, by itself, a laboratory test or physiological measurement, nor a guarantee that you can hold that exact power for 60 minutes.
95% of a 20-minute test is only an estimate
The calculator uses these practical approximations:
| Maximal test duration | FTP estimation factor |
|---|---|
| 8 minutes | average power × 0.90 |
| 20 minutes | average power × 0.95 |
| 30 minutes | average power × 1.00 |
| 60 minutes | average power × 1.00 |
If your average power in a 20-minute time trial is 263 W, the calculator estimates FTP at around 250 W:
263 × 0,95 ≈ 250 W
The 0.95 factor does not work equally for everyone. An athlete with high anaerobic capacity may produce proportionally more power for 20 minutes, while a more endurance-oriented athlete may have a smaller gap between 20-minute and 60-minute power.
To make the test useful:
- Perform it rested, with an appropriate warm-up and good pacing.
- Use a good fan and consistent conditions on an indoor trainer.
- Calibrate or zero-offset your power meter according to the manufacturer’s instructions.
- Use the same power-measurement source when comparing tests.
Do not treat readings from a smart trainer, pedals and crank-based power meter as completely interchangeable. Even two reliable devices can show a small but consistent difference large enough to shift your zone boundaries.
The calculator’s 7 power zones
The 7-zone system provides the most detail for creating and analysing structured sessions:
| Zone | % FTP | Main practical use |
|---|---|---|
| Recovery | ≤55% | Very easy cycling, recovery and rest between repetitions |
| Endurance | 56–75% | Aerobic volume and long rides |
| Tempo | 76–90% | Sustained moderate-to-high intensity |
| Threshold | 91–105% | Intervals near FTP |
| VO2max | 106–120% | Intense aerobic repetitions, usually lasting a few minutes |
| Anaerobic | 121–150% | Short high-power efforts |
| Neuromuscular | >150% | Very short sprints and maximal neuromuscular power |
Percentages alone do not define a session’s intensity. 4×10′ at 95% of FTP and 3×20′ at the same percentage impose different loads. VO2max repetitions must also be assessed by duration, recovery, RPE and the quality maintained through the final repetition.
The Neuromuscular zone needs particular care. The calculator shows >150% as a simple lower boundary, but actual sprint power depends more on your power–duration curve and maximal neuromuscular capacity. Performing a maximal sprint while trying to hold a fixed FTP percentage makes little sense.
Which system should you choose: 3, 5 or 7 zones?
The same FTP can produce different numbers of zones. What changes is the classification’s detail, not your physiology.
- 7 zones: separates Threshold, VO2max, anaerobic intensity and sprints, making it the most useful option for structured sessions.
- 5 zones: groups all intensity above 106% of FTP into
VO2max+. It is simpler, but loses detail at high intensities. - 3 zones: divides power into
Easyup to 79%,Moderateat 80–99% andHardfrom 100% upwards. It gives a broad distribution overview, but is insufficient for precisely prescribing intervals.
The three-zone model in scientific literature usually relies on individual physiological thresholds. The calculator’s percentages are a practical FTP-based approximation; they do not establish your LT1 and LT2.
Watts show external output, not the whole training load
A power meter directly records the power you produce. It does not know the energetic cost of those watts to your body that day.
The same 200 W can produce different heart rates and RPE depending on duration, heat, fuelling, accumulated fatigue, body position, cadence and whether you train indoors or outdoors.
Combine watts with heart rate, breathing and perceived effort. Power is usually the best immediate guide for executing an interval, while heart rate and RPE help interpret internal load.
A session averaging 180 W might involve two almost-steady hours or continual changes between very low and very high intensity. Examine interval structure, total time in zones and variability, not only average power.
How to tell when your zones need updating
One difficult or unusually easy session is not enough to change FTP. First consider sleep, fatigue, temperature, fuelling and potential measurement-device differences.
FTP may be too high if you repeatedly cannot complete well-designed Threshold sessions, effort becomes disproportionate from the first intervals or Endurance rides are harder than they should be. It may be too low if near-Threshold sessions consistently feel very easy and recent performances show that you can produce more power.
Repeat the same test after a training block, or when several sessions and recent performances suggest your zones no longer reflect reality. Consistency in protocol, conditions and device matters more than constantly chasing a new FTP.
Training zones do not automatically define race strategy
In triathlon, target bike power is not obtained simply by choosing an intensity zone or FTP percentage. Account for race duration, the course, heat, aero position, fuelling and, above all, your ability to run well afterwards.
Zones organise training. Race intensity requires separate assessment and confirmation through race-specific sessions.
Key takeaways
- FTP is a practical reference, not a laboratory-confirmed threshold.
20 minutes × 0.95is a general estimate, not a personal physiological rule.- Zones divide training intensity into defined ranges. There is no metabolic “switch” at a zone boundary.
- The 7-zone system offers greater detail; 5- and 3-zone systems simplify classification.
- Neuromuscular power and sprints should not be defined by a fixed FTP percentage.
- Assess sessions using power, heart rate, RPE, duration and conditions together.
- Update zones when several sessions, a race or a well-executed test support reassessment, not after one good or bad session.
Use the Cycling Power Zones Calculator to calculate zones from FTP or a maximal 8-, 20-, 30- or 60-minute test. To assess your internal cycling response too, read Heart Rate Zones from LTHR: why running and cycling need different zones.
Sources and further reading
- Borszcz FK et al. Functional Threshold Power in Cyclists: Validity of the Concept and Physiological Responses. International Journal of Sports Medicine. 2018.
- Inglis EC et al. Maximal Lactate Steady State Versus the 20-Minute Functional Threshold Power Test in Well-Trained Individuals: “Watts” the Big Deal? International Journal of Sports Physiology and Performance. 2020.
- Karsten B et al. Relationship Between the Critical Power Test and a 20-min Functional Threshold Power Test in Cycling. Frontiers in Physiology. 2021.
- Jamnick NA et al. An Examination and Critique of Current Methods to Determine Exercise Intensity. Sports Medicine. 2020.
- Bouillod A et al. Caveats and Recommendations to Assess the Validity and Reliability of Cycling Power Meters: A Systematic Scoping Review. Sensors. 2022.
- TrainingPeaks. Cycling Power Zones Explained: Coggan’s Power Training Levels.
- TrainingPeaks Help Center. Zones Calculator Overview — Power Training Zones.