To finish the Athens Marathon in 3:30, you need an average pace of around 4:59/km. But that pace does not tell you how to start, how much to slow down uphill or what to expect when the course begins to descend.
That is why I created the Athens Marathon Splits Calculator. I collected 4,000 race entries from 2024 and 2025. Of these, 130 had incomplete splits and another 156 were excluded from the main sample because of unusual pacing distributions. This left 3,714 entries in the main sample. I studied the results alongside the course to see how time is distributed in Athens and how that distribution changes with finish time, from two and a half to five hours.
The research also answered practical questions: do you need to gain time early on? How concerned should you be about slowing down uphill? How much time can you recover on the descent? And how differently should you approach the same race when conditions change, with more heat, humidity or headwind?
What exactly can I do with the calculator?
Enter a realistic finish time to see intermediate splits corresponding to a typical execution of an Athens Marathon pacing strategy for that time. This gives you a clearer reference for organising your race plan and understanding where, and by how much, you should expect your pace to change.
For example, here are some of the calculator’s outputs:
| Checkpoint | For a 3:00 finish | For a 3:30 finish |
|---|---|---|
| 5 km | 20:51 | 23:59 |
| 10 km | 41:40 | 47:55 |
| Half marathon | 1:28:51 | 1:42:29 |
| 25 km | 1:46:15 | 2:02:52 |
| 30 km | 2:08:21 | 2:28:53 |
| 35 km | 2:29:59 | 2:54:27 |
| 40 km | 2:50:54 | 3:19:13 |
| Finish | 3:00:00 | 3:30:00 |
These are cumulative times from your own start (net time), shown as minutes:seconds or hours:minutes:seconds. Use them as a reference alongside your effort. There is no need to hit every split to the exact second shown in the table, particularly when conditions or weather call for a different approach. The calculator’s “Show split ranges” option is especially useful here: it gives you a range to work with rather than a single time.
How many results is it based on? Was it checked against other runners?
I began with a sample of 4,000 race entries, 2,000 from each year. Data collection covered five-minute finish-time bands from 2:30 to 5:00, while comparisons grouped results into fifteen-minute bands so that the calculator could better estimate splits for both faster and slower athletes. Of this sample, 3,870 participants had complete, chronologically consistent splits. After checking and removing unusual distributions, the final main sample contained 3,714 entries.
The calculator was then checked against 500 additional race entries outside the original collection. Of these, 484 had complete split and finish-time data, and the remaining 466 entries were used for the main new test. Different finish-time bands were used to draw more specific conclusions. In particular, 110 entries in the 3:00–3:30 band were available for checking the calculator’s results.
Overall, this calculator’s results were much better than those of the original GAP calculator and constant-pace splits. The check also showed where its outputs were closer to runners’ actual results and where a wider margin was needed to represent them.
Does it adapt to my time? How does it differ from the GAP calculator?
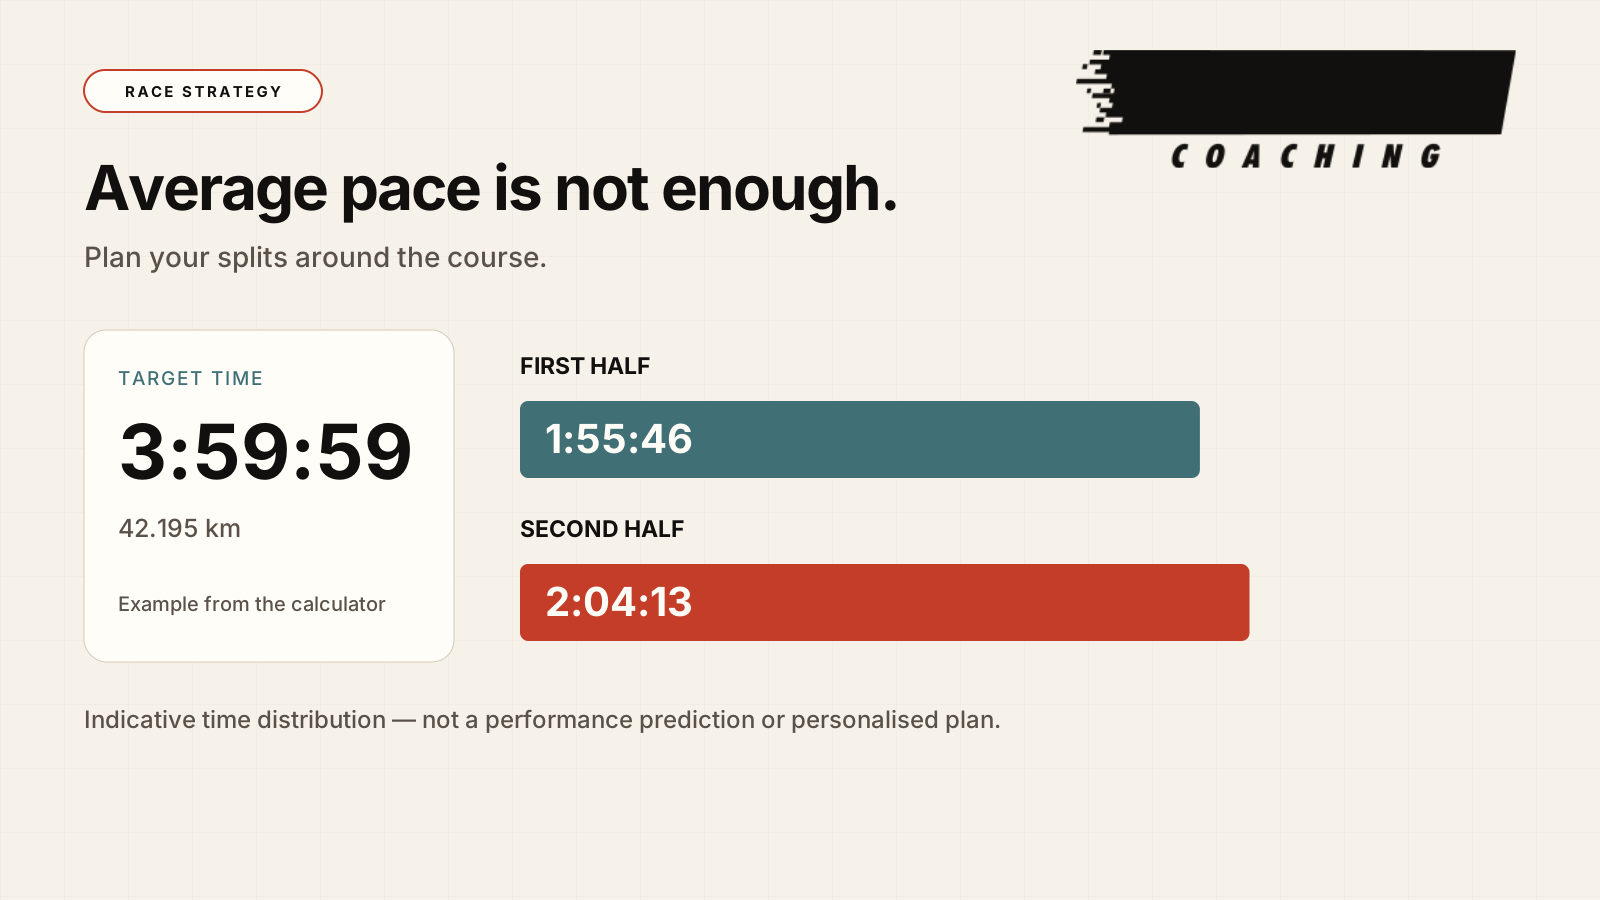
Yes. The calculator changes the proportions of the splits according to finish time. For a three-hour finish, it gives around 1:28:51 and 1:31:09 for the two halves. For four hours, it gives 1:55:47 and 2:04:13. This difference reflects the greater second-half slowdown generally seen among slower runners.
The GAP calculator estimates how gradient affects pace at an equivalent effort. The Athens calculator also uses actual split distributions on this specific course. It therefore better describes how the race typically unfolds, including the slowdown that develops as the kilometres accumulate.
For a 3:30 target, the original GAP model gives a half-marathon split of 1:45:45 and 30 km in 2:32:52. Athens gives 1:42:29 and 2:28:53 respectively. That is a meaningful difference. Its value is in showing two different references: the effect of gradient, and the distribution obtained when actual results are also considered. A greater typical slowdown must not be interpreted as an instruction to start your race more aggressively.
Is an even, negative or positive split better in Athens?
An even split means equal times for the two halves. A negative split means a faster second half; a positive split means a slower one. These terms describe times. Effort, however, also depends on gradient and conditions.
In Athens, the climbing continues well beyond halfway, to around kilometre 31. The course elevation profile shows approximately 161 metres of total ascent in the first half and 168 in the second. The long final descent therefore does not make the entire second half easier.
My coaching takeaway from this research is to keep the early pace controlled, accept slower pace on the climbs and preserve the ability to maintain pace towards the finish. Good race executions can involve a small positive split, an almost even split or a negative split. We do not need to impose a label on every strategy to run the race well.
Do I need a fast first half to achieve a better finish time?
I do not support a general strategy of “banking” time by pushing harder early in the race. The research includes real examples showing another route to the same finish time.
| Actual race entry | First half | Second half | Finish |
|---|---|---|---|
| 2024 | 1:44:38 | 1:44:09 | 3:28:47 |
| 2025 | 1:44:14 | 1:45:10 | 3:29:24 |
Both athletes reached halfway later than the 1:42:29 the calculator gives for a 3:30 finish: the first by 2 minutes and 9 seconds, the second by 1 minute and 45 seconds. Yet both finished under 3:30.
These are two specific examples. In a broader group finishing in 3:25–3:35, 82 of 278 entries had a difference of no more than two minutes between halves. A more balanced execution was therefore not an isolated exception.
If you are slightly behind the central estimate but still feel comfortable for that stage of the race, do not automatically try to recover the difference with a sudden acceleration. A deviation from the Athens Marathon Splits Calculator table does not, by itself, mean your target finish time is lost.
Where should I expect my pace to drop?
The middle of the Athens course requires patience. Between halfway and 30 km, there are approximately 122 metres of climbing; the climbs are particularly sustained up to kilometre 25. Holding the same pace there costs more and requires greater effort.
In the 3:30–3:45 band, the sample’s slowest sections were from halfway to kilometre 25 in 2024 and from kilometre 25 to 30 in 2025. This is useful: slowing down here is consistent with the course’s difficulty. Keep your effort manageable and allow pace to adjust to the changing gradients.
Will the descent after kilometre 31 help me recover lost time?
The descent can give you an opportunity to run faster, but only if you reach it with relatively fresh legs and enough energy. Among 4:45–5:00 finishers, around 36% of the main 2024 sample and 50%!! of the 2025 sample ran the downhill section from kilometre 35 to 40 more slowly even than the uphill section from kilometre 25 to 30.
For comparison, the corresponding proportions among 2:45–3:00 finishers were around 8% and 21%. Faster runners more often retained the ability to make use of the final downhill section.
Do not build your race strategy around the idea that “after 31, I will get all the lost time back”. Plan the start and the uphill sections separately so that you can genuinely benefit from the descent rather than pay for it.
How much does the race plan change with the weather?
Weather has a substantial effect on the strategy you should follow. Always reassess your target before the start, based on the conditions expected on race day. The weather data I collected included specific forecasts along the route and actual observations from the wider area. They agree on one key point: 2025 was noticeably warmer and more humid than 2024.
On the route forecast maps, temperatures near the start were predicted to be 10–11°C in 2024 and 16–17°C in 2025. Midway along the route, at around 11:00, the corresponding values were 13–14°C and 18–19°C, with humidity of around 60–65% in 2024 and 75–80% in 2025. Weather observations confirm the general picture of tougher conditions for athletes in 2025 than in 2024.
Comparing the splits from the 2 editions supports this. Among 3:30–3:45 finishers, the typical difference between the second and first halves was 2 minutes and 58 seconds in 2024, and 5 minutes and 17 seconds in 2025. The second half took a considerably greater toll in the less favourable year.
Can a pace that works in cool weather prove costly in warmer conditions?
This is one of the research’s most useful comparisons. I grouped runners by their pace from kilometre 5 to 10 and examined how much slower they ran from kilometre 35 to 40.
| Pace over km 5–10 | Typical slowdown over km 35–40, 2024 | Corresponding slowdown, 2025 |
|---|---|---|
| 4:30–5:00/km | around 9″/km | around 22″/km |
| 5:00–5:30/km | around 14″/km | around 37″/km |
| 5:30–6:00/km | around 39″/km | around 51″/km |
These groups contained hundreds of entries from each year. In the middle pace band of 5:00–5:30/km specifically, there were 335 entries in 2024 and 348 in 2025. Despite similar early pace, the slowdown towards the finish was considerably greater in 2025.
I also examined 63 potential matches of the same athletes across the two years, with no more than a one-minute difference over the first ten kilometres, to compare entries with similar early pace. Of these, 47 had a slower finish time in 2025. The first half was typically just 35 seconds slower, while the second was 3 minutes and 32 seconds slower. The greater difference emerged later in the race.
My coaching interpretation is that pace should always adapt to the day’s weather. Being able to hold a particular pace over the opening kilometres does not mean you can sustain it to the finish, especially in less favourable conditions.
Why does this matter particularly for a four- or five-hour target?
Because you will spend longer on the course and experience greater strain. Temperatures at an early-morning start are lower than those a runner will face 4 or 5 hours later. A slower runner will therefore often encounter higher temperatures in the final part of the race. Starting in one of the later waves also affects the conditions you face from the outset.
Other research has also documented the greater burden on slower athletes in warmer races. In our data, late-race slowing was much more pronounced among finish times approaching five hours. For these runners, a realistic target, a restrained start and heat acclimatisation before race day have particular practical value. Conditions at the start do not describe the conditions you will face throughout your race.
How can the Heat Adjusted Pace Calculator help?
You can use the Heat Adjusted Pace Calculator for an initial estimate of how temperature and humidity affect pace. In “Cool effort → Heat pace” mode, an effort equivalent to 5:00/km in cool conditions can translate to around 5:06/km at 22°C and 70% humidity. That difference amounts to roughly four minutes over a marathon, assuming those conditions remain constant.
In the scenarios I examined for the two years, the Heat Adjusted Pace Calculator suggested around 1–3 additional minutes for 3:30 runners using the route forecasts, and around 3–4 minutes using the warmer observations from the wider area. This is useful as an indication of scale, but it cannot assess each runner individually.
The actual performance difference can be larger. Among 329 potential matches of the same athletes who finished in 3:30–3:45 in 2024, their 2025 finish was typically 6 minutes and 53 seconds slower. Alongside temperature and humidity, we must also consider wind, preparation and overall race management.
Use this calculator’s estimate to reassess your target against the expected weather before calculating your splits. For a four- to five-hour target in particular, take a more conservative approach because of the longer exposure to heat. The Heat examples I examined concern a 3:30 effort. According to the original model’s creator, its underlying sample extends to around 3:30. Estimates for four- or five-hour finishes are more uncertain, and you need to account for changing conditions while you remain on the course.
How much does wind matter? What can the Wind Pace Calculator show?
Wind also affects pace and effort, and the same wind speed has very different effects depending on its direction. Combining the course direction with the available forecasts suggests a generally more favourable wind direction in 2024. In 2025, wind was more often a headwind or cross-headwind over much of the route, with greater crosswind exposure in the middle section.
To illustrate the practical effect, I tested the Wind Pace Calculator at 5:00/km, with a 25 km/h wind, a body mass of 68 kg and the “Suburbs” profile, representing moderate shelter:
| Wind direction | Estimated pace at the same effort |
|---|---|
| Direct headwind | 5:29/km |
| Crosswind | 5:04/km |
| Tailwind | 4:52/km |
The tool calculates the aerodynamic cost and offers a useful indication of its effect on pace. As always, the seconds lost into a headwind exceed those gained from a tailwind.
Enter the forecast wind speed in km/h, the relative wind direction and the appropriate environment. You can also select wind direction using the pointer in the calculator’s infographic.
However, do not multiply +29″ by 42 km to predict wind’s cost on the Athens course. The route does not maintain a single compass direction, and wind is not always constant. Use these tools—Heat, Wind and GAP—to understand the general effects of wind, gradients and heat on a given effort, then choose a realistic target finish time for the conditions.
What if congestion slows me down at the start?
Congestion over the opening kilometres is a reality in the Athens Marathon, especially in the later starting waves. Accept that it will slow you down. I recommend gradually finding space and your rhythm, avoiding repeated accelerations to recover a few lost seconds.
In the sample I examined, around one in five athletes took over 30 seconds longer for their first five kilometres than for their second. The calculator describes actual splits from the race start, but it does not separately estimate the congestion your own wave will experience.
Compare your splits using net or chip time: the time since you personally crossed the start line. Gun time measures elapsed time from the official race start—the starting gun. Waiting before you cross the line is not added to your net time. Delays caused by congestion after the start line, however, do count.
How accurate should I expect the outputs to be?
In the new check of the Athens Marathon Splits Calculator’s reliability, the mean absolute deviation from actual intermediate splits was around 2 minutes and 23 seconds, compared with 4 minutes and 14 seconds for the original GAP calculator. For this check, I entered an athlete’s actual finish time and measured how far the calculator’s outputs differed from that athlete’s actual splits.
In finish-time bands from 2:45 to 3:45, mean deviations ranged from around 1 minute and 23 seconds to 1 minute and 59 seconds. In the 4:45–5:00 band, the mean absolute deviation was 3 minutes and 45 seconds. In this new check, the Athens Marathon Splits Calculator showed smaller mean deviations in the 2:45–3:45 bands.
Deviations at individual checkpoints were greater in the middle of the race—around 3 minutes and 30 seconds at 25 km—and smaller near the finish. I recommend using “Show split ranges”: the check found that around 78 out of 100 splits fell within the range displayed when this option was enabled.
How should I use the Athens Marathon Splits Calculator to prepare my race?
First, set your target based on your preparation, then reassess it against the expected race-day weather and, separately, the hours you will spend on the course. Enter that time in the Athens calculator and keep a few key reference points: 10 km, halfway, 25, 30 and 35 km.
Plan your start to leave something in reserve for the climbs, where your pace will inevitably drop. Before accelerating downhill, assess your cumulative time, your effort and the fatigue you have accumulated. After the race, those same checkpoints will help you identify where you stayed in control and where the effort began to take its toll.
The calculator provides specific, interesting and useful information. Your decision is how to apply it to your own race, taking account of your preparation, the weather and your target finish time. For most runners in this event, the main aim is to reach the final section still able to run at a steady, relatively fast pace. Athens is a demanding course, and small mistakes in its first 2 sections can prove costly in the final third.
A brief clarification: the research describes race entries and actual splits without knowing each runner’s fitness, intentions or more specific personal data. The tool organises a target finish time; your own optimal distribution may differ. Detailed checks and limitations are presented in the research paper and accompanying methodology on Zenodo.
Sources and further reading
-
Athens Marathon, The Authentic. Official results and courses for the 2024 and 2025 editions.
-
National Observatory of Athens / meteo.gr. Special marathon route forecast for 10 November 2024.
-
National Observatory of Athens / meteo.gr. Special marathon route forecast for 9 November 2025.
-
Iowa Environmental Mesonet. Weather observation archive—regional LGAV reports on both race days.
-
Davis JJ. Wind Calculator for Runners — methodology and limitations. Running Writings.